> ## Documentation Index
> Fetch the complete documentation index at: https://docs.domino.ai/llms.txt
> Use this file to discover all available pages before exploring further.
# Basic Domino health
The following sections describe the basic troubleshooting steps and useful tools that cover the overall Domino platform health.
## Admin toolkit
Deploy the Domino [Admin toolkit](/6.3/admin/admin-toolkit) if you have not already.
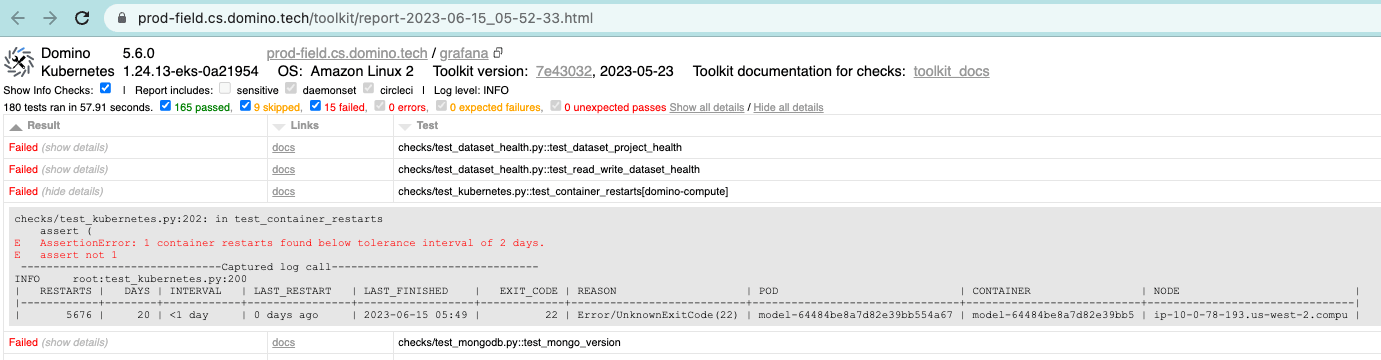
Use the Admin toolkit to run a health check and observe the overall system status.
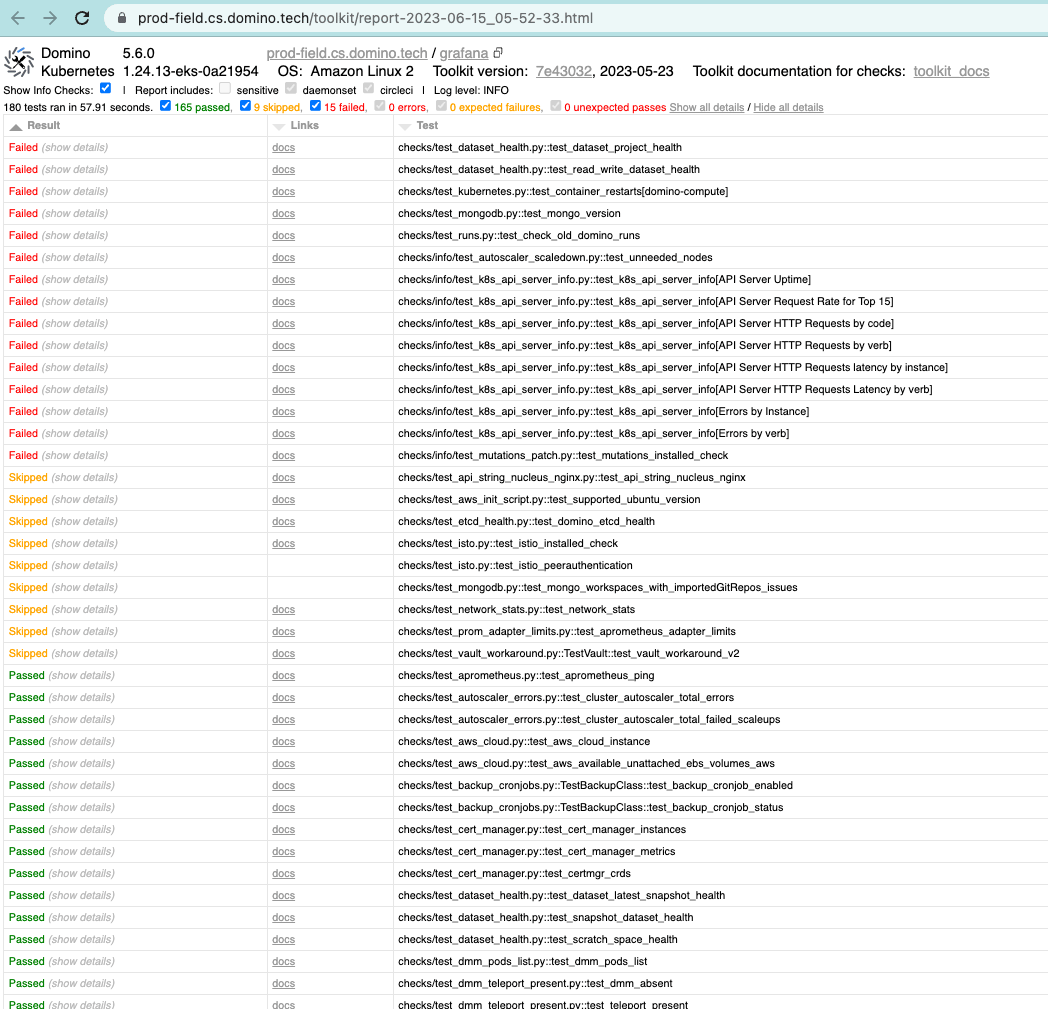 Expand each failed section to get more information.
 ## Grafana dashboards
Domino Grafana dashboards provide various metric visualizations around Domino services. For production deployments, a Grafana instance is deployed and externally accessible at `/grafana`. The default username is `grafana` and the password is stored in the cluster.
```shell theme={null}
$ kubectl get secret -n domino-platform grafana -ojsonpath=
'{.data.admin-password}'| base64 -d; echo
```
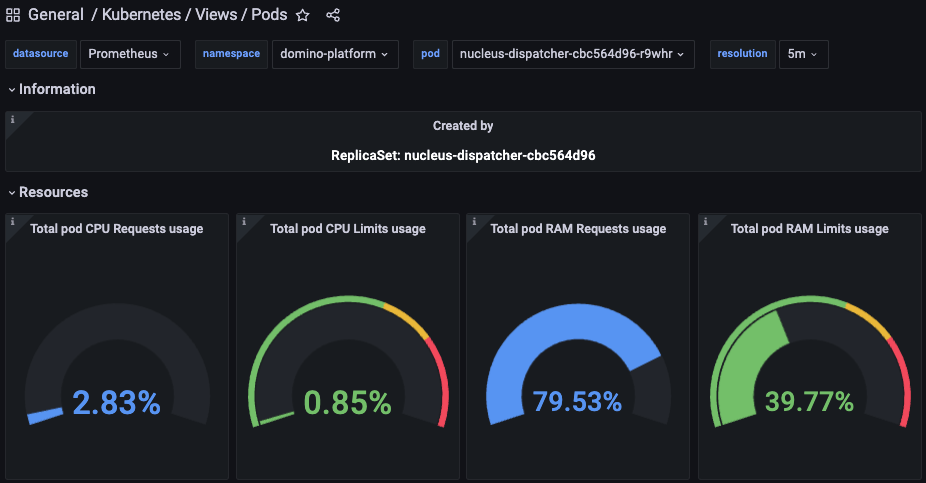
There are preconfigured dashboards that are readily available for review during troubleshooting. Below is an example of the Nucleus dispatcher’s health.
## Grafana dashboards
Domino Grafana dashboards provide various metric visualizations around Domino services. For production deployments, a Grafana instance is deployed and externally accessible at `/grafana`. The default username is `grafana` and the password is stored in the cluster.
```shell theme={null}
$ kubectl get secret -n domino-platform grafana -ojsonpath=
'{.data.admin-password}'| base64 -d; echo
```
There are preconfigured dashboards that are readily available for review during troubleshooting. Below is an example of the Nucleus dispatcher’s health.
 ## Kubernetes pod health
Check if there are any pods that are not in Active or Completed status, as this is the starting place to look at potential issues.
```shell theme={null}
$ ~ % kubectl get pods -A | egrep -v "(Running|Completed)"
NAMESPACE NAME READY STATUS RESTARTS AGE
domino-compute model-64484be8a7d82e39bb554a67-65fb5f9c48-7hlgd 3/4 CrashLoopBackOff 5547 (3m43s ago) 19d
tigera-operator tigera-operator-657cc89589-k7tp5 0/1 CrashLoopBackOff 5241 (2m1s ago) 19d
```
Keep an eye on the RESTARTS column. If there are many restarts of a certain pod, that pod is having issues. Describing the pods should give you more information as to why they are not in the running state or frequently restart.
## Kubernetes events
Kubernetes events usually provide underlying issues behind the user experience. Look for related events in domino-platform and domino-compute namespaces sorted by time stamp.
```shell theme={null}
$ ~ % kubectl get events --sort-by='.metadata.creationTimestamp' -n domino-platform
LAST SEEN TYPE REASON OBJECT MESSAGE
53m Warning Unhealthy pod/zookeeper-2 Liveness probe failed:
52m Normal Scheduled pod/kuberhealthy-frontend-liveness-1686765147 Successfully assigned domino-platform/kuberhealthy-frontend-liveness-1686765147 to ip-10-0-124-141.us-west-2.compute.internal
52m Normal Created pod/kuberhealthy-frontend-liveness-1686765147 Created container kuberhealthy-frontend-liveness
52m Normal Pulled pod/kuberhealthy-frontend-liveness-1686765147 Container image "quay.io/domino/kuberhealthy.http-check:latest-358998" already present on machine
52m Normal Started pod/kuberhealthy-frontend-liveness-1686765147 Started container kuberhealthy-frontend-liveness
45m Normal SuccessfulCreate job/dmm-parquet-conversion-job-28112760 Created pod: dmm-parquet-conversion-job-28112760-k4ptr
45m Normal SuccessfulCreate cronjob/dmm-parquet-conversion-job Created job dmm-parquet-conversion-job-28112760
45m Normal Scheduled pod/dmm-parquet-conversion-job-28112760-k4ptr Successfully assigned domino-platform/dmm-parquet-conversion-job-28112760-k4ptr to ip-10-0-124-141.us-west-2.compute.internal
```
## Resource availability
Sometimes pods can exceed the CPU and memory limits imposed by the default Kubernetes configuration.
```shell theme={null}
$ kubectl top pods -n domino-platform --sort-by=cpu
NAME CPU(cores) MEMORY(bytes)
docker-registry-0 259m 37Mi
fleetcommand-reporter-64fbb8cb6b-bcdxs 184m 12Mi
rabbitmq-ha-311-2 163m 216Mi
prometheus-server-0 105m 1763Mi
rabbitmq-ha-311-1 96m 193Mi
rabbitmq-ha-311-0 93m 179Mi
mongodb-replicaset-1 80m 744Mi
mongodb-replicaset-0 71m 910Mi
mongodb-replicaset-2 71m 783Mi
newrelic-infrastructure-monitor-services-68c5c66c-fqqnm 55m 65Mi
nucleus-frontend-7749b69687-d6sh4 48m 7929Mi
nucleus-frontend-7749b69687-8kwhz 45m 7853Mi
newrelic-infrastructure-d4g8f 40m 29Mi
dmm-redis-ha-server-0 35m 16Mi
nucleus-dispatcher-56cb5884b7-b5sgp 34m 6185Mi
redis-ha-server-0 29m 1123Mi
mongodb-primary-0 28m 262Mi
mongodb-secondary-0 26m 259Mi
```
The following shows the CPU and memory usage of the current nodes.
```shell theme={null}
$ prod-field % kubectl top node
NAME CPU(cores) CPU% MEMORY(bytes) MEMORY%
ip-10-0-101-39.us-west-2.compute.internal 103m 1% 1600Mi 5%
ip-10-0-118-253.us-west-2.compute.internal 291m 3% 9306Mi 30%
ip-10-0-124-141.us-west-2.compute.internal 421m 5% 12506Mi 40%
ip-10-0-33-46.us-west-2.compute.internal 125m 1% 5670Mi 18%
ip-100-164-53-223.us-west-2.compute.internal 1212m 30% 2935Mi 19%
$ prod-field % kubectl top node -l dominodatalab.com/node-pool=platform
NAME CPU(cores) CPU% MEMORY(bytes) MEMORY%
ip-10-0-118-253.us-west-2.compute.internal 374m 4% 9308Mi 30%
ip-10-0-124-141.us-west-2.compute.internal 380m 4% 12484Mi 40%
ip-10-0-34-218.us-west-2.compute.internal 338m 4% 6127Mi 20%
```
## Next steps
The following sections provide useful steps to troubleshoot:
* [Connectivity and latency](/6.3/admin/troubleshooting/connectivity-and-slowness-issues)
* [Workspaces and Jobs issues](/6.3/admin/troubleshooting/workspaces-and-jobs-issues)
* [Compute environment build issues](/6.3/admin/troubleshooting/compute-environment-build-issues)
* [Domino endpoint issues](/6.3/admin/troubleshooting/model-api-issues)
* [Distributed model monitoring issues](/6.3/admin/troubleshooting/dmm-issues)
* [Data sources issues](/6.3/admin/troubleshooting/data-sources-issues)
## Kubernetes pod health
Check if there are any pods that are not in Active or Completed status, as this is the starting place to look at potential issues.
```shell theme={null}
$ ~ % kubectl get pods -A | egrep -v "(Running|Completed)"
NAMESPACE NAME READY STATUS RESTARTS AGE
domino-compute model-64484be8a7d82e39bb554a67-65fb5f9c48-7hlgd 3/4 CrashLoopBackOff 5547 (3m43s ago) 19d
tigera-operator tigera-operator-657cc89589-k7tp5 0/1 CrashLoopBackOff 5241 (2m1s ago) 19d
```
Keep an eye on the RESTARTS column. If there are many restarts of a certain pod, that pod is having issues. Describing the pods should give you more information as to why they are not in the running state or frequently restart.
## Kubernetes events
Kubernetes events usually provide underlying issues behind the user experience. Look for related events in domino-platform and domino-compute namespaces sorted by time stamp.
```shell theme={null}
$ ~ % kubectl get events --sort-by='.metadata.creationTimestamp' -n domino-platform
LAST SEEN TYPE REASON OBJECT MESSAGE
53m Warning Unhealthy pod/zookeeper-2 Liveness probe failed:
52m Normal Scheduled pod/kuberhealthy-frontend-liveness-1686765147 Successfully assigned domino-platform/kuberhealthy-frontend-liveness-1686765147 to ip-10-0-124-141.us-west-2.compute.internal
52m Normal Created pod/kuberhealthy-frontend-liveness-1686765147 Created container kuberhealthy-frontend-liveness
52m Normal Pulled pod/kuberhealthy-frontend-liveness-1686765147 Container image "quay.io/domino/kuberhealthy.http-check:latest-358998" already present on machine
52m Normal Started pod/kuberhealthy-frontend-liveness-1686765147 Started container kuberhealthy-frontend-liveness
45m Normal SuccessfulCreate job/dmm-parquet-conversion-job-28112760 Created pod: dmm-parquet-conversion-job-28112760-k4ptr
45m Normal SuccessfulCreate cronjob/dmm-parquet-conversion-job Created job dmm-parquet-conversion-job-28112760
45m Normal Scheduled pod/dmm-parquet-conversion-job-28112760-k4ptr Successfully assigned domino-platform/dmm-parquet-conversion-job-28112760-k4ptr to ip-10-0-124-141.us-west-2.compute.internal
```
## Resource availability
Sometimes pods can exceed the CPU and memory limits imposed by the default Kubernetes configuration.
```shell theme={null}
$ kubectl top pods -n domino-platform --sort-by=cpu
NAME CPU(cores) MEMORY(bytes)
docker-registry-0 259m 37Mi
fleetcommand-reporter-64fbb8cb6b-bcdxs 184m 12Mi
rabbitmq-ha-311-2 163m 216Mi
prometheus-server-0 105m 1763Mi
rabbitmq-ha-311-1 96m 193Mi
rabbitmq-ha-311-0 93m 179Mi
mongodb-replicaset-1 80m 744Mi
mongodb-replicaset-0 71m 910Mi
mongodb-replicaset-2 71m 783Mi
newrelic-infrastructure-monitor-services-68c5c66c-fqqnm 55m 65Mi
nucleus-frontend-7749b69687-d6sh4 48m 7929Mi
nucleus-frontend-7749b69687-8kwhz 45m 7853Mi
newrelic-infrastructure-d4g8f 40m 29Mi
dmm-redis-ha-server-0 35m 16Mi
nucleus-dispatcher-56cb5884b7-b5sgp 34m 6185Mi
redis-ha-server-0 29m 1123Mi
mongodb-primary-0 28m 262Mi
mongodb-secondary-0 26m 259Mi
```
The following shows the CPU and memory usage of the current nodes.
```shell theme={null}
$ prod-field % kubectl top node
NAME CPU(cores) CPU% MEMORY(bytes) MEMORY%
ip-10-0-101-39.us-west-2.compute.internal 103m 1% 1600Mi 5%
ip-10-0-118-253.us-west-2.compute.internal 291m 3% 9306Mi 30%
ip-10-0-124-141.us-west-2.compute.internal 421m 5% 12506Mi 40%
ip-10-0-33-46.us-west-2.compute.internal 125m 1% 5670Mi 18%
ip-100-164-53-223.us-west-2.compute.internal 1212m 30% 2935Mi 19%
$ prod-field % kubectl top node -l dominodatalab.com/node-pool=platform
NAME CPU(cores) CPU% MEMORY(bytes) MEMORY%
ip-10-0-118-253.us-west-2.compute.internal 374m 4% 9308Mi 30%
ip-10-0-124-141.us-west-2.compute.internal 380m 4% 12484Mi 40%
ip-10-0-34-218.us-west-2.compute.internal 338m 4% 6127Mi 20%
```
## Next steps
The following sections provide useful steps to troubleshoot:
* [Connectivity and latency](/6.3/admin/troubleshooting/connectivity-and-slowness-issues)
* [Workspaces and Jobs issues](/6.3/admin/troubleshooting/workspaces-and-jobs-issues)
* [Compute environment build issues](/6.3/admin/troubleshooting/compute-environment-build-issues)
* [Domino endpoint issues](/6.3/admin/troubleshooting/model-api-issues)
* [Distributed model monitoring issues](/6.3/admin/troubleshooting/dmm-issues)
* [Data sources issues](/6.3/admin/troubleshooting/data-sources-issues)