> ## Documentation Index
> Fetch the complete documentation index at: https://docs.domino.ai/llms.txt
> Use this file to discover all available pages before exploring further.
# Drift detection for monitored models
[Prediction data](/cloud/platform-capabilities/features/monitoring/3-set-up-domino-endpoints/1-set-up-prediction-capture#capture-prediction-data) is the output produced by a model. You must add data that was trained on historical data to your model’s code to start ingesting and storing prediction data for monitoring.
You can register prediction data for a model that uses a Snowflake data source once per table.
If you registered a `timestamp` variable or if you register it with the ground truth dataset, Domino will automatically retrieve new data every 24 hours at 12:00 AM UTC. See [Monitoring Config JSON](/cloud/platform-capabilities/features/monitoring/8-json). When you deregister the model, Domino stops retrieving the data.
If you don’t register the `timestamp` variable, the prediction data is ingested once, and for every new batch, you must register a new dataset.
1. Click the registered model and go to the Data Drift page.
If you want to do this from the Overview page, go to **Add Data** > **Prediction Data**.
2. Click **Register Prediction \< Upload Prediction Config**.
3. In the Register Prediction window, upload or paste a JSON configuration that describes the prediction variables and the location of the prediction dataset.
The following is a sample file. This file doesn’t require any variable information. You can include prediction variableTypes, although, you typically include these when you define your training data to get a complete set of metrics. If you define the variables here, you will only get drift predictions. You can also define the following variables: `sample_weight`, `prediction_probability`, and `timestamp`. The configuration must always include the `datasetDetails` and `modelMetadata` information.
See [Monitoring Config JSON](/cloud/platform-capabilities/features/monitoring/8-json) for details about each field in the JSON.
```console theme={null}
{
"variables": [
{
"name": "campaign",
"variableType": "sample_weight",
"valueType": "numerical"
}
],
"datasetDetails": {
"name": "Predictions.csv",
"datasetType": "file",
"datasetConfig": {
"path": "Predictions.csv",
"fileFormat": "csv"
},
"datasourceName": "abc-shared-bucket",
"datasourceType": "s3"
}
}
```
4. Click **Register Prediction** and the Model Monitor will start calculating drift on the registered dataset.
## Check the status of prediction data
After you add the prediction data, you might want to check its status.
1. From the navigation pane, click **Model Monitor**.
2. Click the name of the model for which you set up ground truth data ingestion.
3. On the Overview page’s **Data Traffic** tab, you can see the history of the ingested data and review the model’s metadata and schema.
4. Click **Ingest History** to check to see if the status is `Done`. The following are other statuses you might see:
**`Completed with Warnings`**\
Click the three vertical dots at the end of the row and click **View Details**.
**`Failed`**\
Click the three vertical dots at the end of the row and click **View Details**.
If the ingestion failed, Domino stops the continuous ingestion. After you fix the issue, re-register the prediction data and Domino restarts continuous ingestion from this point.
If you re-register the same dataset, Domino processes the entire table again. This causes duplicate records which affects the drift and model quality calculations.
**`Skipped`**\
The dataset had no rows to fetch.
You can click **Status** to select checkboxes to filter by status.
5. Click **Refresh** to see a graph of the **Data Ingest Timeline**.
After the data is ingested, you can perform an ad-hoc [model quality analysis](/cloud/platform-capabilities/features/monitoring/5-use-monitoring/3-analyze-data-drift) to validate your setup. Then, [set up a schedule](/cloud/platform-capabilities/features/monitoring/4-set-up-model-monitor/8-set-scheduled-checks-mm) to perform model quality analysis automatically.
## Analyze data drift
After the drift calculations are complete, you can see the divergence value for each feature in the Drift column. The computation used the default **Test Type** and **Threshold** values.
1. To access this page, in the navigation pane, click **Model Monitor**.
2. Go to the model whose data drift you want to see and then click **Data Drift**.
To change the default settings to experiment with other Test Types, Conditions, and Default Threshold Values, in the navigation pane click **Settings**. Then, click [Test Defaults](/cloud/platform-capabilities/features/monitoring/7-monitor-settings/4-tests), make your changes and click **Save**.
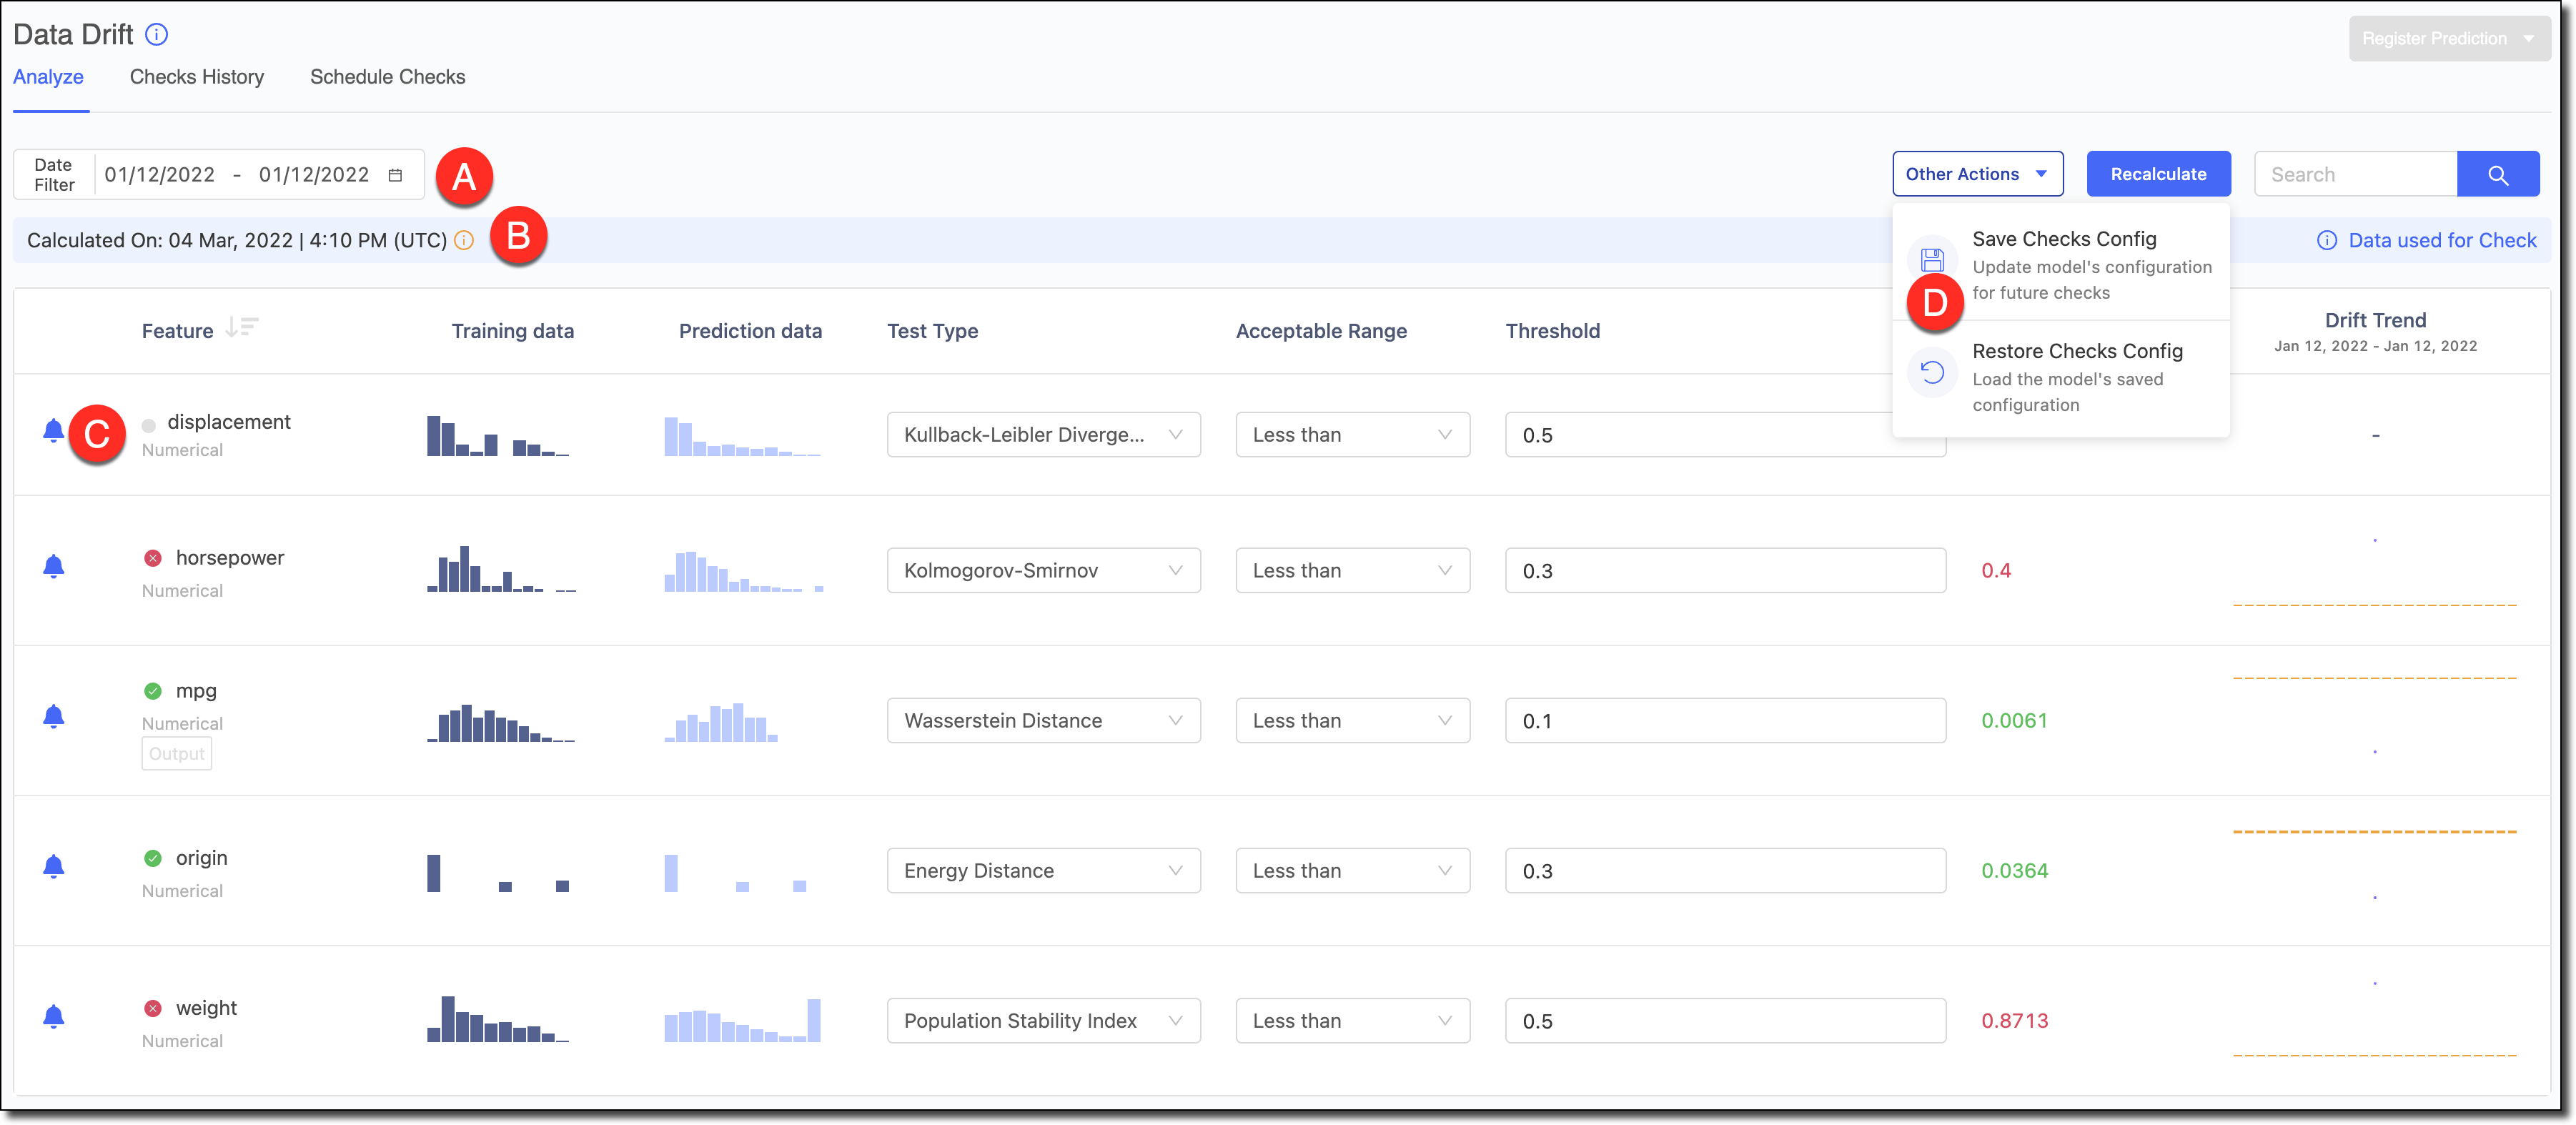 A - Use the Date Filter to refine the data and review the Drift and its trends for specific periods.
B - If your model had a timestamp column declared, it’s used to get the timestamp of different predictions in the dataset. If the timestamp wasn’t declared, then the data’s ingestion time in the Model Monitor is used as its timestamp.
C - To reduce alert noise, click the bell icon next to features to disable alerts to exclude them from the Scheduled Checks.
D - If you made changes to the test types, thresholds, and so on and want to save them as the default configuration for the model to be used for running scheduled checks, go to **Other Actions > Save Checks Config** to save the changes. If you experimented with configurations and wanted to load the model’s default configuration to reset the Analyze table, go to **Other Actions > Restore Checks Config**.
A - Use the Date Filter to refine the data and review the Drift and its trends for specific periods.
B - If your model had a timestamp column declared, it’s used to get the timestamp of different predictions in the dataset. If the timestamp wasn’t declared, then the data’s ingestion time in the Model Monitor is used as its timestamp.
C - To reduce alert noise, click the bell icon next to features to disable alerts to exclude them from the Scheduled Checks.
D - If you made changes to the test types, thresholds, and so on and want to save them as the default configuration for the model to be used for running scheduled checks, go to **Other Actions > Save Checks Config** to save the changes. If you experimented with configurations and wanted to load the model’s default configuration to reset the Analyze table, go to **Other Actions > Restore Checks Config**.