

Prediction data is analyzed through 23:59 of the previous day. Data from the current day is not included. Domino reads the timestamps in the dataset if they are present; if not, it uses the ingestion timestamp.
Prerequisites
- Model is registered for monitoring
- Prediction data is available for Domino to monitor
Modify the data drift analysis
Out-of-the-box, the Model Monitor supports several statistical tests. Each feature can have a different test. When a new model is registered, it inherits the global default test settings. However, you can change the test types and thresholds to values suitable for each model. If you save these changes, they are used for subsequent automated checks, such as when new predication data is uploaded or when Scheduled Checks run for the model.Modify the test features
- If you are using the monitoring feature for a Domino endpoint, go to Configure monitoring > Target Ranges to access the Configure Tests and Thresholds page.
- If you are using the Model Monitor, in the navigation pane, click Model Monitor. Select the model that you want to monitor and then click Data Drift.
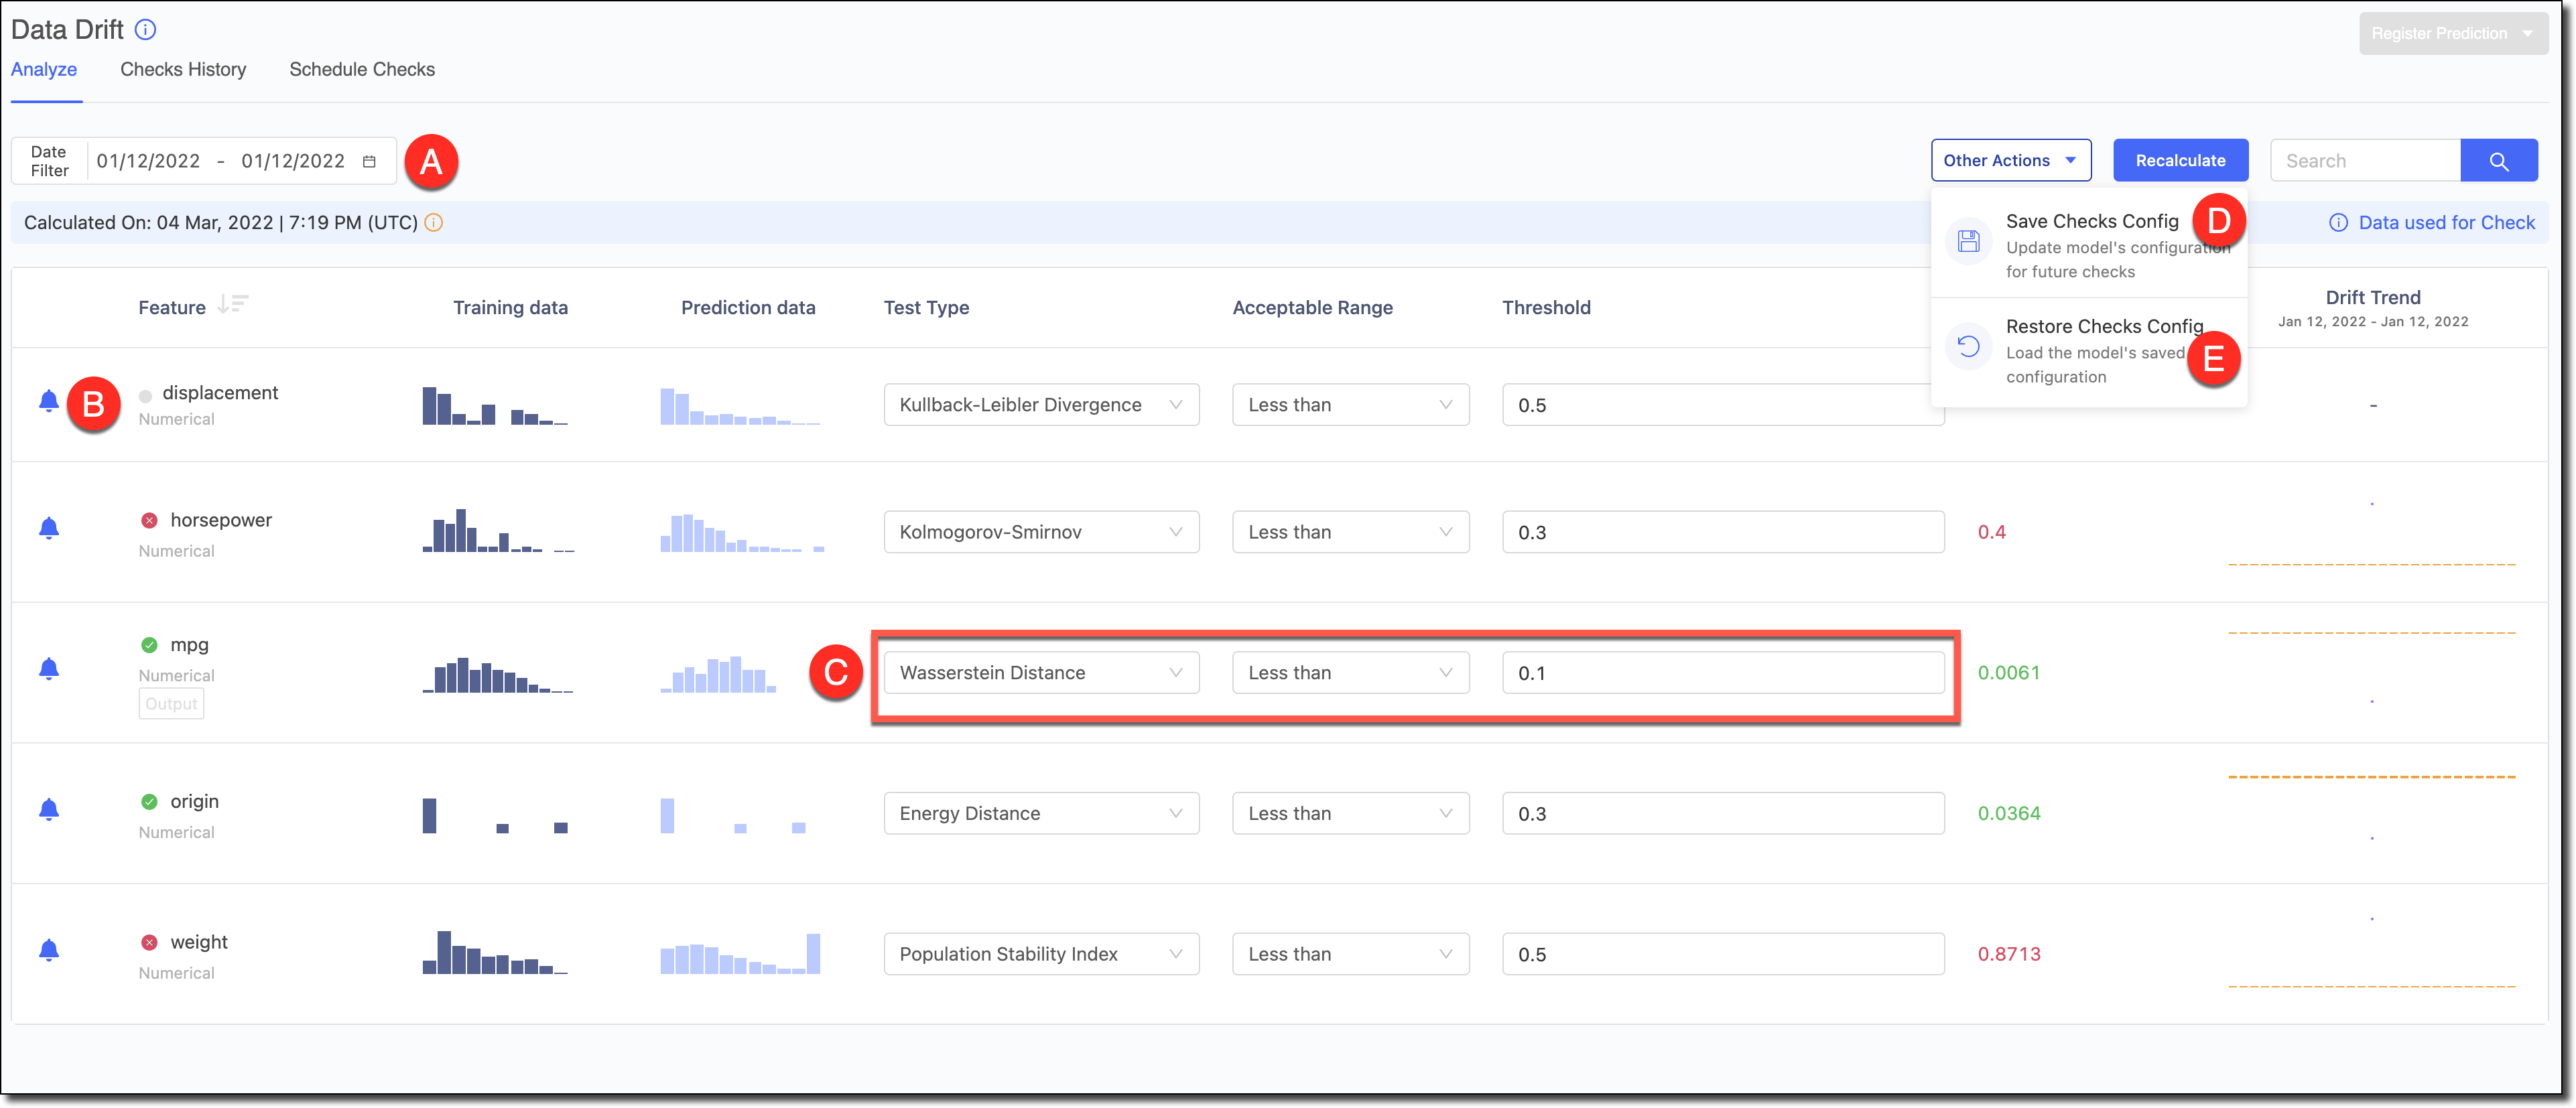
If your model had a timestamp column declared, it’s used to get the timestamp of different predictions in the dataset. If the timestamp wasn’t declared, then the data’s ingestion time in the Model Monitor is used as its timestamp.
Data drift statistical tests
Out-of-the-box, the Model Monitor supports several statistical tests.The lower the Population Stability Index (PSI) value, the better the prediction data matches the training data. If there is no difference between the data sets, the value is 0. Typically:
- PSI < 0.1 = no significant change
- PSI < 0.2 = moderate change
- PSI >= 0.2 = significant change
Kullback–Leibler divergence (also called relative entropy) is a measure of how one probability distribution is different from a second, reference probability distribution. The divergence can range from zero to infinity. A value of zero means there is no difference between the data sets. This test works for different distributions and therefore is most commonly used to detect drift. Chi-square Statistic
Chi-square test in another popular divergence test well-suited for categorical data. The chi square statistic is a statistical hypothesis testing technique to test how two distributions of categorical variables are related to each other. Specifically, the chi-square statistic is a single number that quantifies the difference between the observed counts versus the counts that are expected if there was no relationship between the variables at all. The divergence can range from zero to infinity. A value of zero means there is no difference between the data sets. Population Stability Index
Population Stability Index (PSI) is a popular metric in the finance industry to measure changes in distribution for two datasets. It produces less noise and has the advantage of a generally accepted threshold of 0.2-0.25.