

How agent versions are created
Agent versions are created when you run your evaluation script as a Domino Job, not from a workspace. Each run captures:- The code commit used for the Job.
-
The YAML agent configuration (model, prompts, parameters) logged via
DominoAgentContext(agent_config_path=…). - All traces generated during execution, with inline evaluation scores.
- Aggregated metrics across all traces in the run.
View traces in an agent version
View and analyze traces from any agent version:- In your project, click Experiments in the left navigation.
- Find and click the experiment you want to review.
- Open an agent version and select the Traces tab.
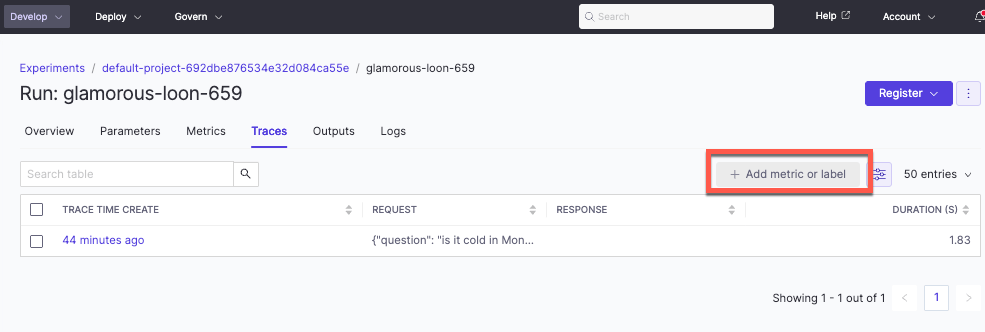
- See evaluation scores logged by your inline evaluators.
- Add metrics (float values) or labels (string values) by clicking Add Metric/Label for manual annotation.
- Click any metric or label cell to open the detailed trace view with the full span tree.
Compare agent versions
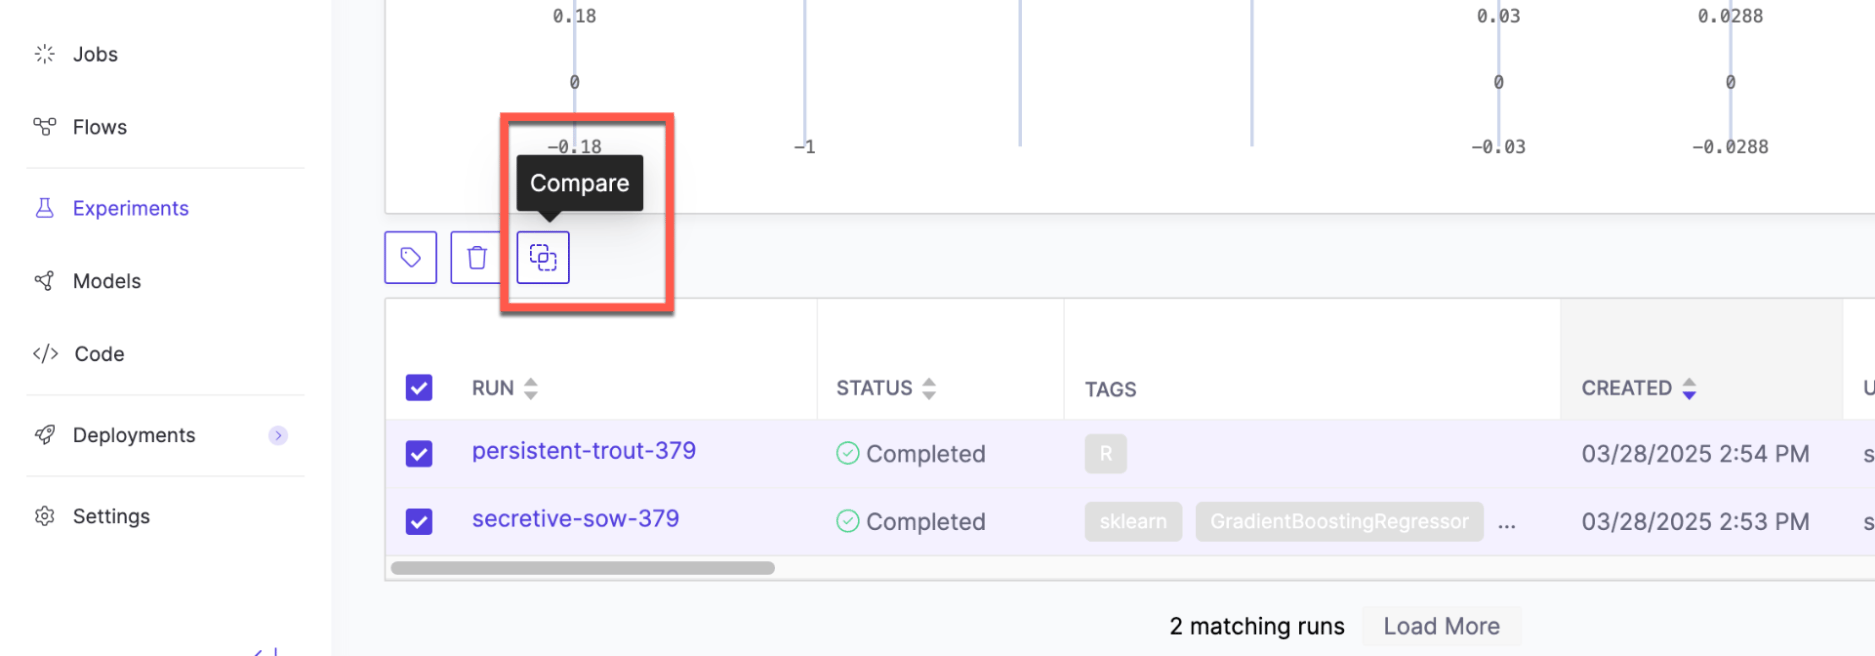
Compare different agent configurations (runs) to see how changes to prompts, models, or parameters affect quality:- From the experiment view, select two to four runs and click Compare.
- The comparison view shows aggregated metrics side by side for each run.
- Open the Traces comparison view to compare individual traces across runs. This shows you exactly where one configuration outperforms another on the same inputs.
Deploy from an agent version
Once you’ve identified a winning configuration, you can deploy it to production directly from the Experiment Manager. Only agent versions that originated from a Job are eligible for deployment. Domino uses the Job’s code commit and agent config to maintain full lineage from experiment to production. Deploy agentic systems has the step-by-step walkthrough.Manual annotations
Subject matter experts can manually annotate traces beyond automated evaluation scores:- Metrics: Add numeric scores (float values) to any trace by clicking Add Metric/Label.
- Labels: Add string labels such as “approved”, “needs review”, or “hallucination” to categorize traces.
Programmatic trace analysis
You can pull trace data programmatically using the MLflow APIs for custom aggregation and analysis. This is useful when you want to do your own analytical work with the trace data beyond the built-in dashboards. Examples include breaking down token usage, latency, and tool calls by span type, or building custom comparison visualizations in a notebook. The rag-agent-demo repository has a notebook example that demonstrates pulling span-level metrics and visualizing them.Export results
Export data in two formats:- CSV: Open the experiment and click the three dots in the upper right.
- PDF report: Select two to four runs to compare and click the three dots in the upper right.
Next steps
- Develop agentic systems: Iterate on instrumentation and evaluation.
- Deploy agentic systems: Production deployment details and configuration.
- Monitor agentic systems: Track production performance.
- Python SDK for agents: A full API reference for tracing, evaluation, and trace search.