

All users can access basic performance metrics through the Domino endpoint interface. Domino administrators have additional access to advanced Grafana dashboards with detailed metrics, alerting, and historical analysis capabilities.
Access model performance metrics
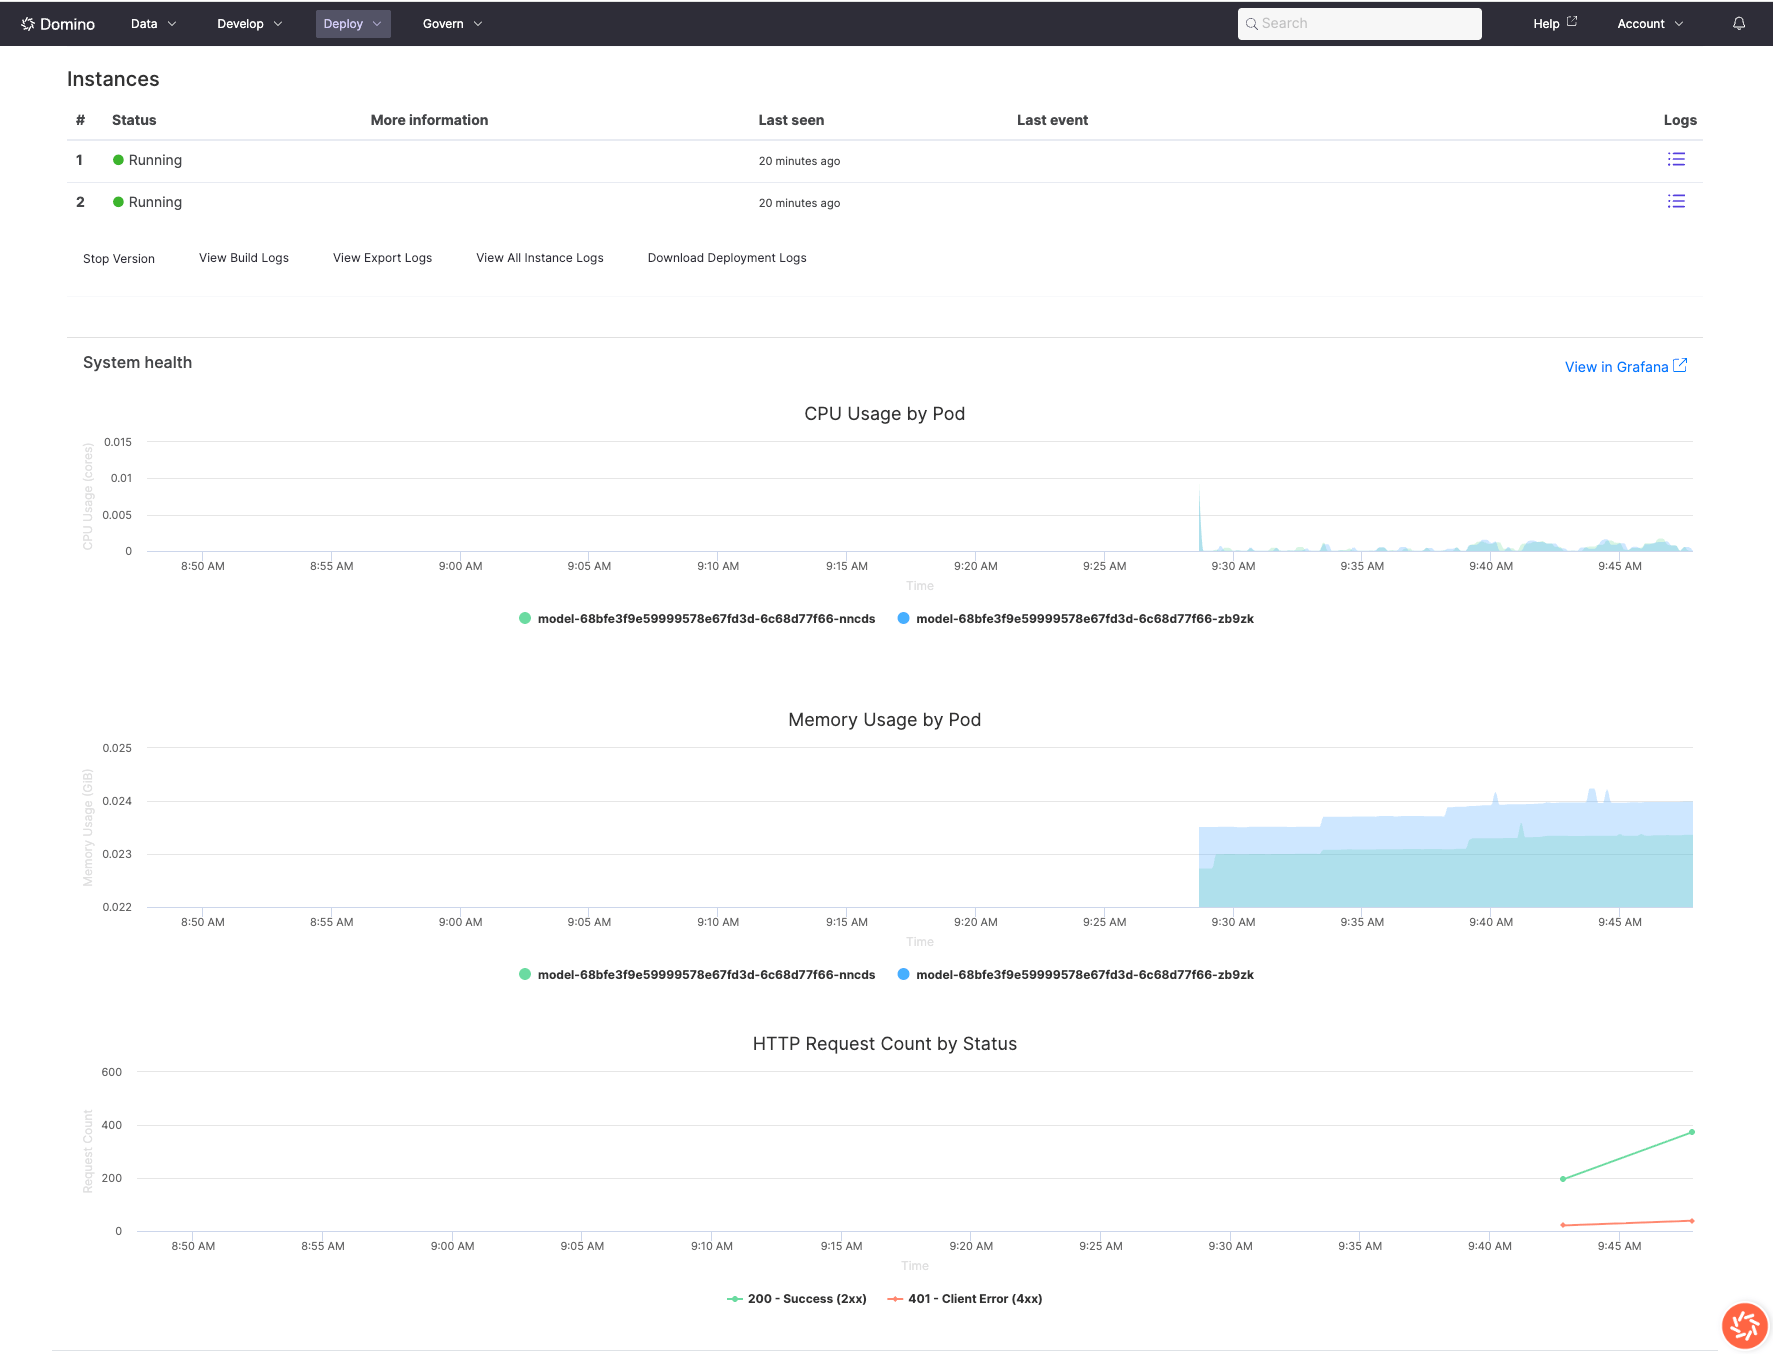
View real-time and historical performance metrics for your deployed model endpoints through the Domino interface:- Navigate to Endpoints in your Domino Workspace.
- Select the endpoint you want to monitor.
- Click Versions to see all available model versions.
- Select the specific version you want to monitor.
- CPU and memory usage: Real-time resource consumption metrics
- Traffic volume: Request patterns and throughput statistics
- Status code distribution: Success rates and error patterns by HTTP status codes
- Grafana dashboard link (for Domino administrators): Direct access to advanced monitoring dashboards
Understand resource usage metrics
Monitor how your model consumes computational resources to identify optimization opportunities and ensure cost-effective deployments. The Domino endpoint interface provides basic resource metrics that help you understand your model’s performance:- CPU usage graphs: Visual representation of processor utilization over time
- Memory consumption charts: Memory usage patterns and trends
- Traffic volume metrics: Request rates and distribution patterns
- Status code breakdowns: Success rates and error patterns
Monitor workflow
Integrate monitoring into your development and deployment pipeline: Development phase- Establish baseline performance metrics during initial model testing
- Use resource metrics to right-size compute resources and optimize code
- Validate performance under realistic load conditions before deployment
- Monitor performance regressions between model versions
- Test health check configurations and timeout settings
- Validate monitoring and alerting configurations
- Monitor deployment health and performance immediately after release
- Set up proactive alerting based on baseline metrics
- Document performance expectations and escalation procedures
- Use historical trends to identify optimization opportunities
- Correlate performance metrics with business impact
- Implement continuous improvement based on monitoring insights
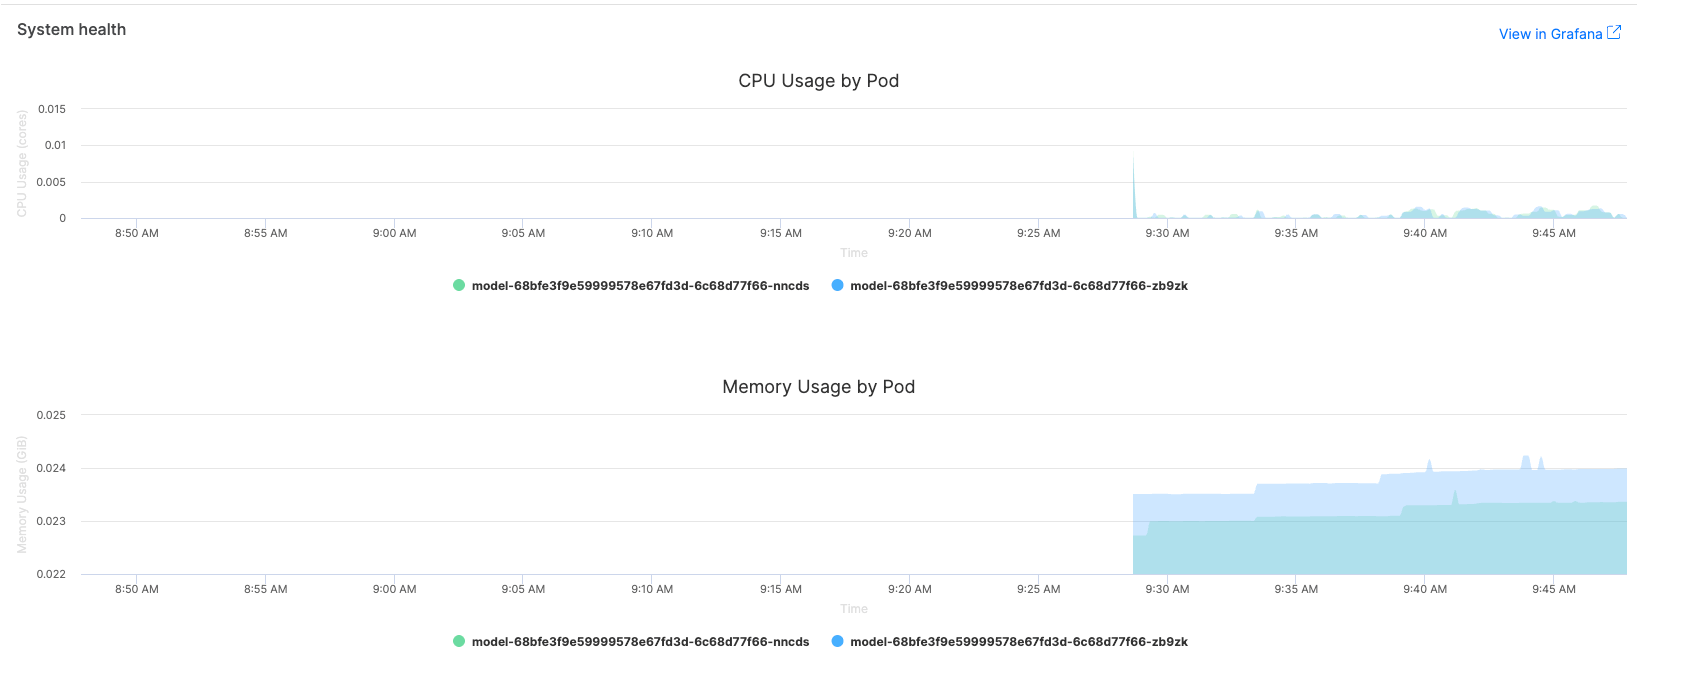
CPU utilization
Track processor usage to understand computational load:- Normal range: 20-60% for most models during steady load
- Optimization needed: Sustained usage >80% indicates inefficient code or undersized resources
- Investigation triggers: Sudden spikes or erratic patterns
Memory consumption
Monitor memory usage patterns to detect leaks and optimize allocation:- Steady state: Memory usage should stabilize after model initialization
- Memory leaks: Continuously increasing memory over time
- Optimization opportunities: High memory usage with low throughput
What to watch for
Track errors and status codes
Monitor request success rates and identify failure patterns to ensure reliable model serving.HTTP status code patterns
- 2xx (Success): Successful predictions - target >99%
- 4xx (Client errors): Invalid requests, authentication failures - investigate if >1%
- 5xx (Server errors): Model failures, resource exhaustion - critical if >0.1%
Common error scenarios
- Authentication issues (401): Check API key configuration and permissions
- Bad requests (400): Review input validation and data format requirements
- Timeout errors (504): Optimize model performance or increase timeout settings
- Resource exhaustion (503): Scale resources or optimize memory usage

Configure health checks and timeouts
Domino monitors every Domino endpoint’s health and ability to respond to new inference requests. You can adjust health check settings to optimize reliability and response behavior for your specific model requirements. To configure health check settings:- Navigate to Endpoints and select a Domino endpoint.
- Go to Settings > Advanced.
- Adjust the health check fields based on your model’s requirements and performance characteristics.
Health check parameters
Configure these parameters based on your model’s performance characteristics and reliability requirements: Initial delayThe time (in seconds) Domino waits before a new endpoint can receive incoming requests. Set this based on your model’s initialization requirements:
- Simple models: 10-30 seconds
- Complex models with large dependencies: 60-120 seconds
- Models requiring external resource loading: 120+ seconds
How often (in seconds) Domino checks endpoint health. The formula Health check period × Failure threshold must be greater than the Override request timeout. Recommended settings:
- High-availability models: 10-15 seconds for quick failure detection
- Standard models: 30 seconds for balanced monitoring
- Resource-intensive models: 60+ seconds to avoid unnecessary checks
The time (in seconds) Domino waits before a health check request is considered as failed. Set this based on your model’s typical response time:
- Set to 2-3 times your model’s P95 response time
- Minimum recommended: 5 seconds
- For slow models: 30+ seconds
The number of consecutive failed health checks before Domino considers the endpoint instance unrecoverable and restarts it. Balance between quick failure detection and avoiding unnecessary restarts:
- Critical production models: 2-3 failures for quick recovery
- Development/testing: 5+ failures to allow debugging
- Resource-constrained environments: 3-5 failures to balance stability
The time (in seconds) before Domino times out an inference request and responds with
504 Gateway Timeout. The default is 60 seconds. Set based on your model’s expected response times:
- Real-time inference: 5-30 seconds
- Batch processing models: 60-300 seconds
- Complex analytical models: 300+ seconds
Timeout behavior
When requests exceed the configured timeout:- Domino responds with HTTP 504 Gateway Timeout
- Endpoint remains available for new requests
- Consider optimizing model performance or increasing timeout for consistently slow models
Optimize model performance
Use monitoring insights to improve your model’s efficiency and reliability.Performance optimization workflow
- Establish a baseline: Record initial performance metrics after deployment
- Generate test traffic: Use consistent load testing to identify bottlenecks
- Analyze patterns: Look for resource spikes, memory growth, or latency increases
- Implement optimizations: Apply code improvements based on monitoring insights
- Validate improvements: Compare metrics before and after optimization
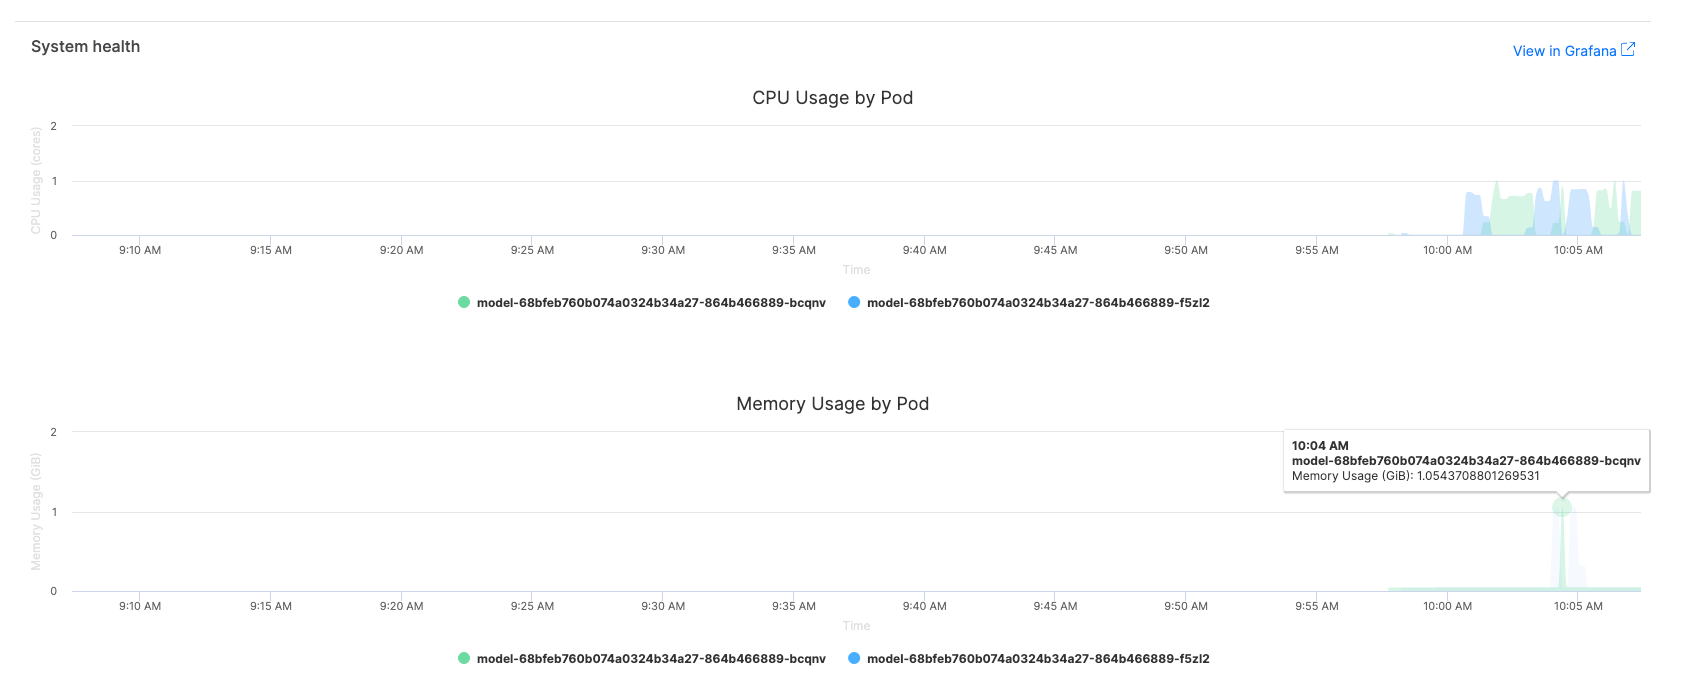
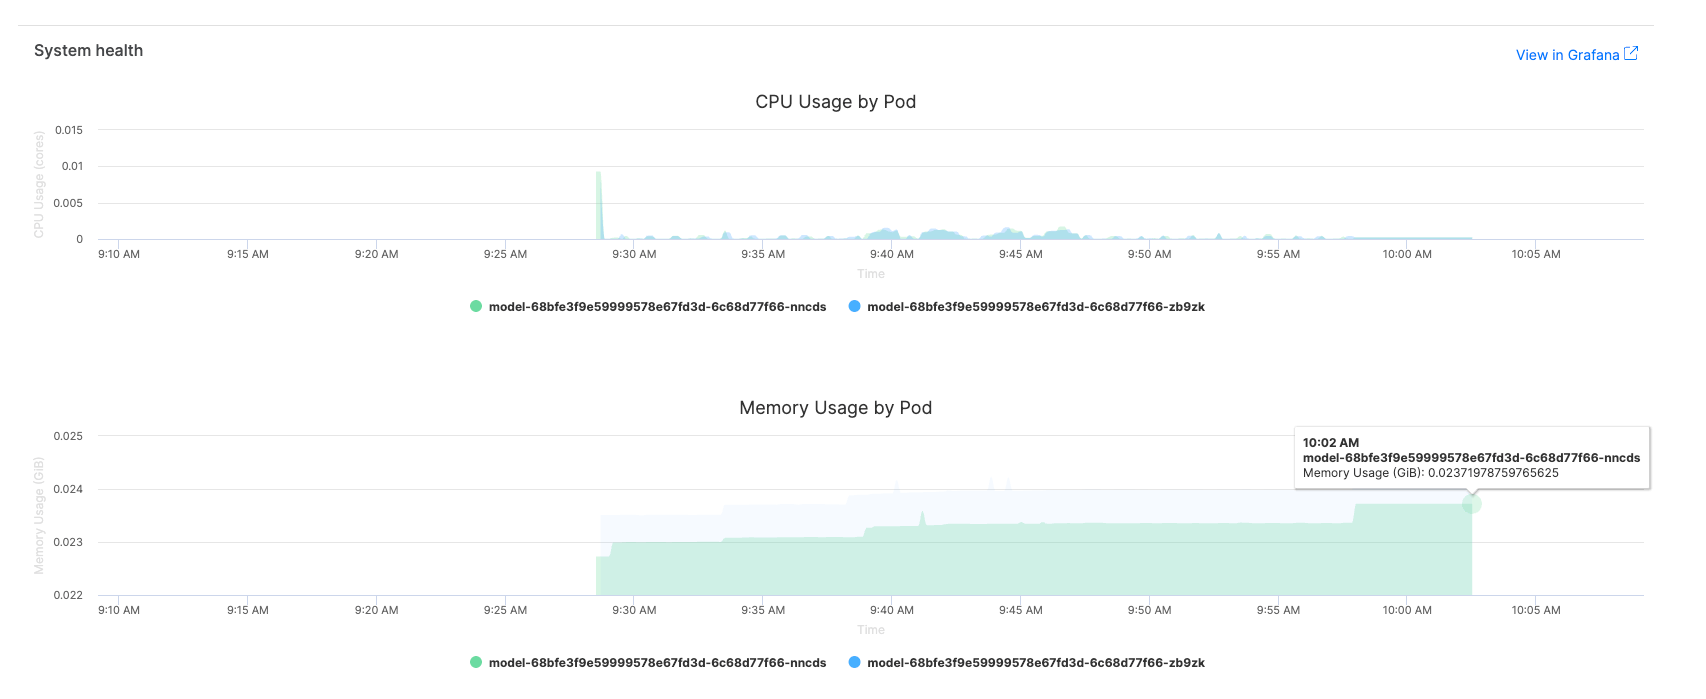
Compare performance across model versions
One of the key advantages of Domino’s monitoring interface is the ability to easily switch between model versions and compare their performance:- Navigate to your endpoint and select Versions
- Click between different version numbers to view their respective metrics
- Compare CPU usage, memory consumption, traffic patterns, and error rates across versions
- Identify performance regressions or improvements between deployments
Common optimization strategies
Reduce CPU usage- Use vectorized operations instead of loops
- Implement result caching for repeated computations
- Optimize data structures and algorithms
- Process data in smaller batches
- Clear unused variables and intermediate results
- Use memory-efficient data structures
- Preload models and dependencies during initialization
- Implement asynchronous processing where possible
- Optimize data preprocessing pipelines
Set up performance alerts
Configure alerts to proactively identify performance issues.Recommended alert thresholds
When working with IT administrators to set up alerts, consider these thresholds based on the basic metrics available in the Domino interface:- CPU usage: Alert if >80% for more than 10 minutes
- Memory usage: Alert if >1 GB increase in 1 hour
- Error rate: Alert if >2% of requests fail
Collaborate with IT administrators
For regular users- Review basic performance metrics (CPU, memory, traffic volume, status codes) directly in the Domino endpoint interface
- Report performance issues with specific metrics and timeframes to IT administrators
- Work with IT teams to interpret trends and plan optimizations
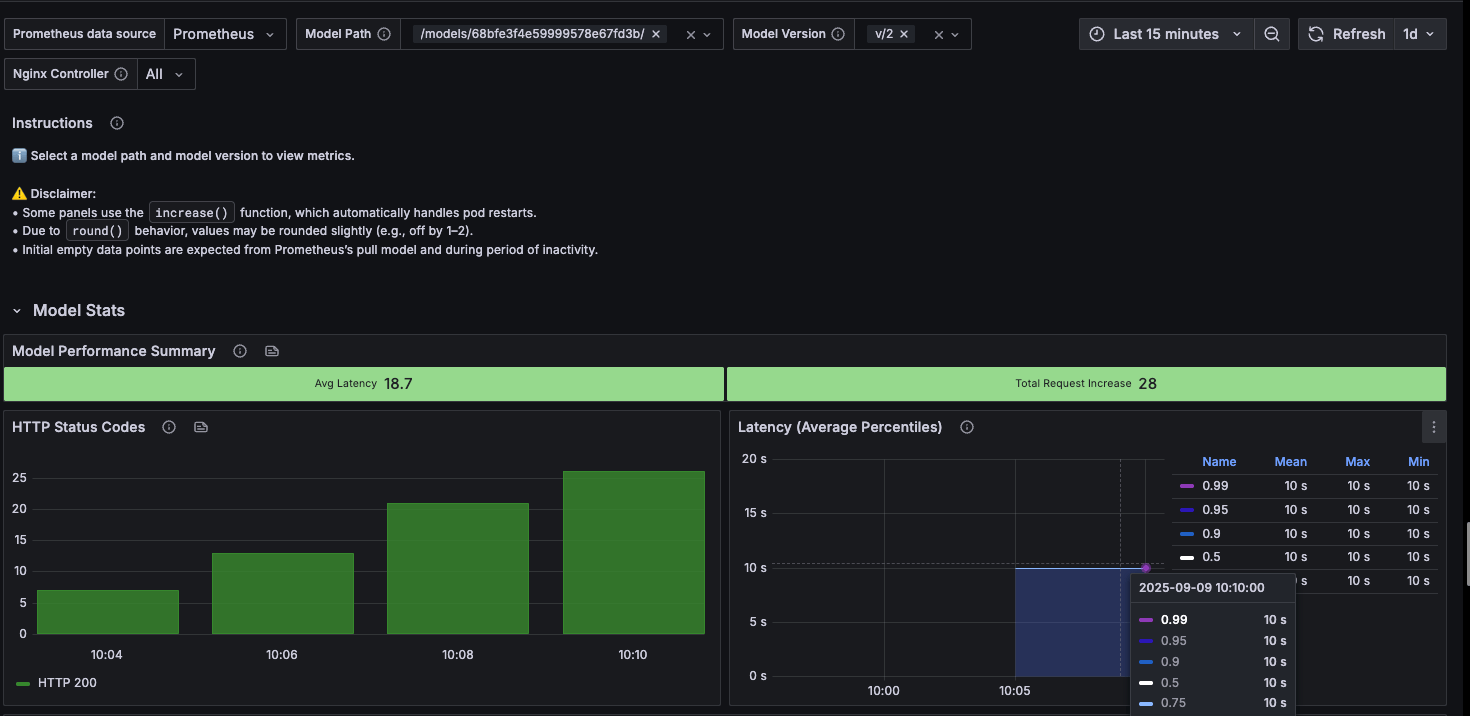
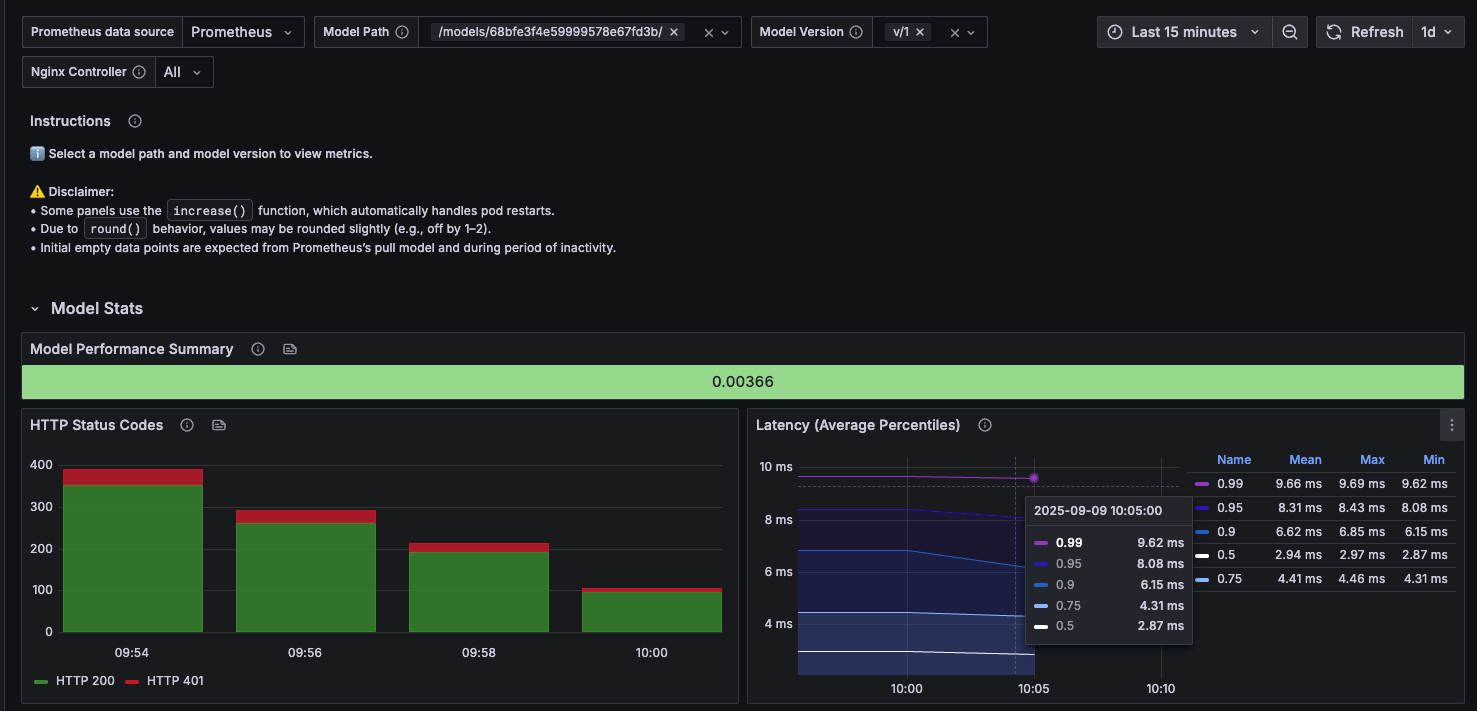
- Access comprehensive Grafana dashboards with advanced metrics and alerting
- Set up shared dashboards for model performance monitoring
- Configure appropriate alert thresholds for your use case
- Establish escalation procedures for critical performance issues
- Review resource allocation and scaling policies
- Use the Grafana link on endpoint version pages for direct dashboard access with pre-selected model filters
- Or access through Admin > Reports > Grafana > Dashboards > Model Endpoints
Example: Debug a resource-heavy model
Consider a model with high resource usage. Use the monitoring dashboard to:- Identify the problem: CPU usage consistently >90%, memory growing over time
- Analyze patterns: High resource usage correlates with specific request types
- Investigate code: Review model inference logic for inefficiencies
- Implement fixes: Optimize data processing, add result caching
- Validate improvement: Monitor metrics to confirm optimization success
Performance comparison
Before optimization- CPU usage: 90-95% sustained
- Memory usage: 1.2 GB growing to 2.5 GB over 24 hours
- Error rate: 3% (mostly timeouts and 5xx errors)
- Response times: Noticeably slow, frequent timeouts
- CPU usage: 30-45% average
- Memory usage: Stable at 150 MB
- Error rate: <0.1%
- Response times: Significantly improved performance
Access endpoint logs
Domino provides comprehensive logging for troubleshooting and auditing your endpoints. Access logs through the Logs column for any endpoint version to review deployment events, runtime behavior, and error details.Log types
Build logsEvents and processes during image building. Review these to understand build failures, dependency issues, or environment setup problems. Contains build definitions and metadata needed to complete the build process. Export logs
Details about the endpoint export process. Use these to troubleshoot issues with model packaging and deployment preparation. Shows how Domino processes your model files and creates the deployable endpoint. Instance logs
Runtime logs from individual containers for a given endpoint instance. Essential for debugging model execution issues, request processing problems, and runtime errors. Filter by endpoint and container to focus on specific components. Deployment logs
Chronological events related to deployment lifecycle. Includes heartbeats, jobs, deployments, and Kubernetes events with detailed payloads containing pod and status information. Critical for understanding deployment state and infrastructure issues.
Use logs for troubleshooting
- Performance issues: Check instance logs for memory warnings, slow processing messages, or resource constraints.
- Failed requests: Review instance logs around the time of errors to identify specific failure causes and stack traces.
- Deployment problems: Examine deployment logs for Kubernetes events, pod startup issues, or resource allocation failures.
- Build failures: Use build logs to identify missing dependencies, environment configuration errors, or package conflicts.
- Health check failures: Look for patterns in instance logs that correlate with health check timeout issues.
Best practices
Development workflow integration
- Establish monitoring early: Implement performance monitoring during model development, not just after deployment
- Set performance baselines: Record initial performance metrics for each model version to track regressions
- Use monitoring for architecture decisions: Let resource usage patterns guide compute sizing and optimization strategies
- Test with production-like loads: Validate performance under realistic data volumes and request patterns before deployment
- Automate performance testing: Integrate monitoring validation into your CI/CD pipelines
Production monitoring strategy
- Implement layered monitoring: Combine basic Domino metrics with advanced Grafana dashboards for comprehensive coverage
- Set up proactive alerting: Configure alerts based on your established baselines and business requirements
- Monitor deployment health: Track performance immediately after releases to catch deployment-related issues
- Document escalation procedures: Create clear runbooks for performance issues and recovery procedures
- Regular performance reviews: Schedule weekly or monthly reviews of performance trends and optimization opportunities
Performance optimization workflow
- Data-driven optimization: Use monitoring data to identify specific bottlenecks rather than guessing
- Version comparison: Leverage Domino’s version switching to compare performance across model iterations
- Resource right-sizing: Use CPU and memory metrics to optimize compute resource allocation
- Health check tuning: Adjust health check parameters based on actual model performance characteristics
- Continuous improvement: Implement feedback loops between monitoring insights and model development
Next steps
- Secure model deployments by implementing security best practices for production model endpoints.
- Scale model deployments by configuring auto-scaling and resource management for high-traffic models.
- IT Admin: Model endpoint monitoring dashboards allow advanced Grafana dashboards for comprehensive infrastructure monitoring.