

Domino / Views / Workloads
Example of the Domino / Views / Workloads dashboard
Example of the Domino / Views / Workloads dashboard
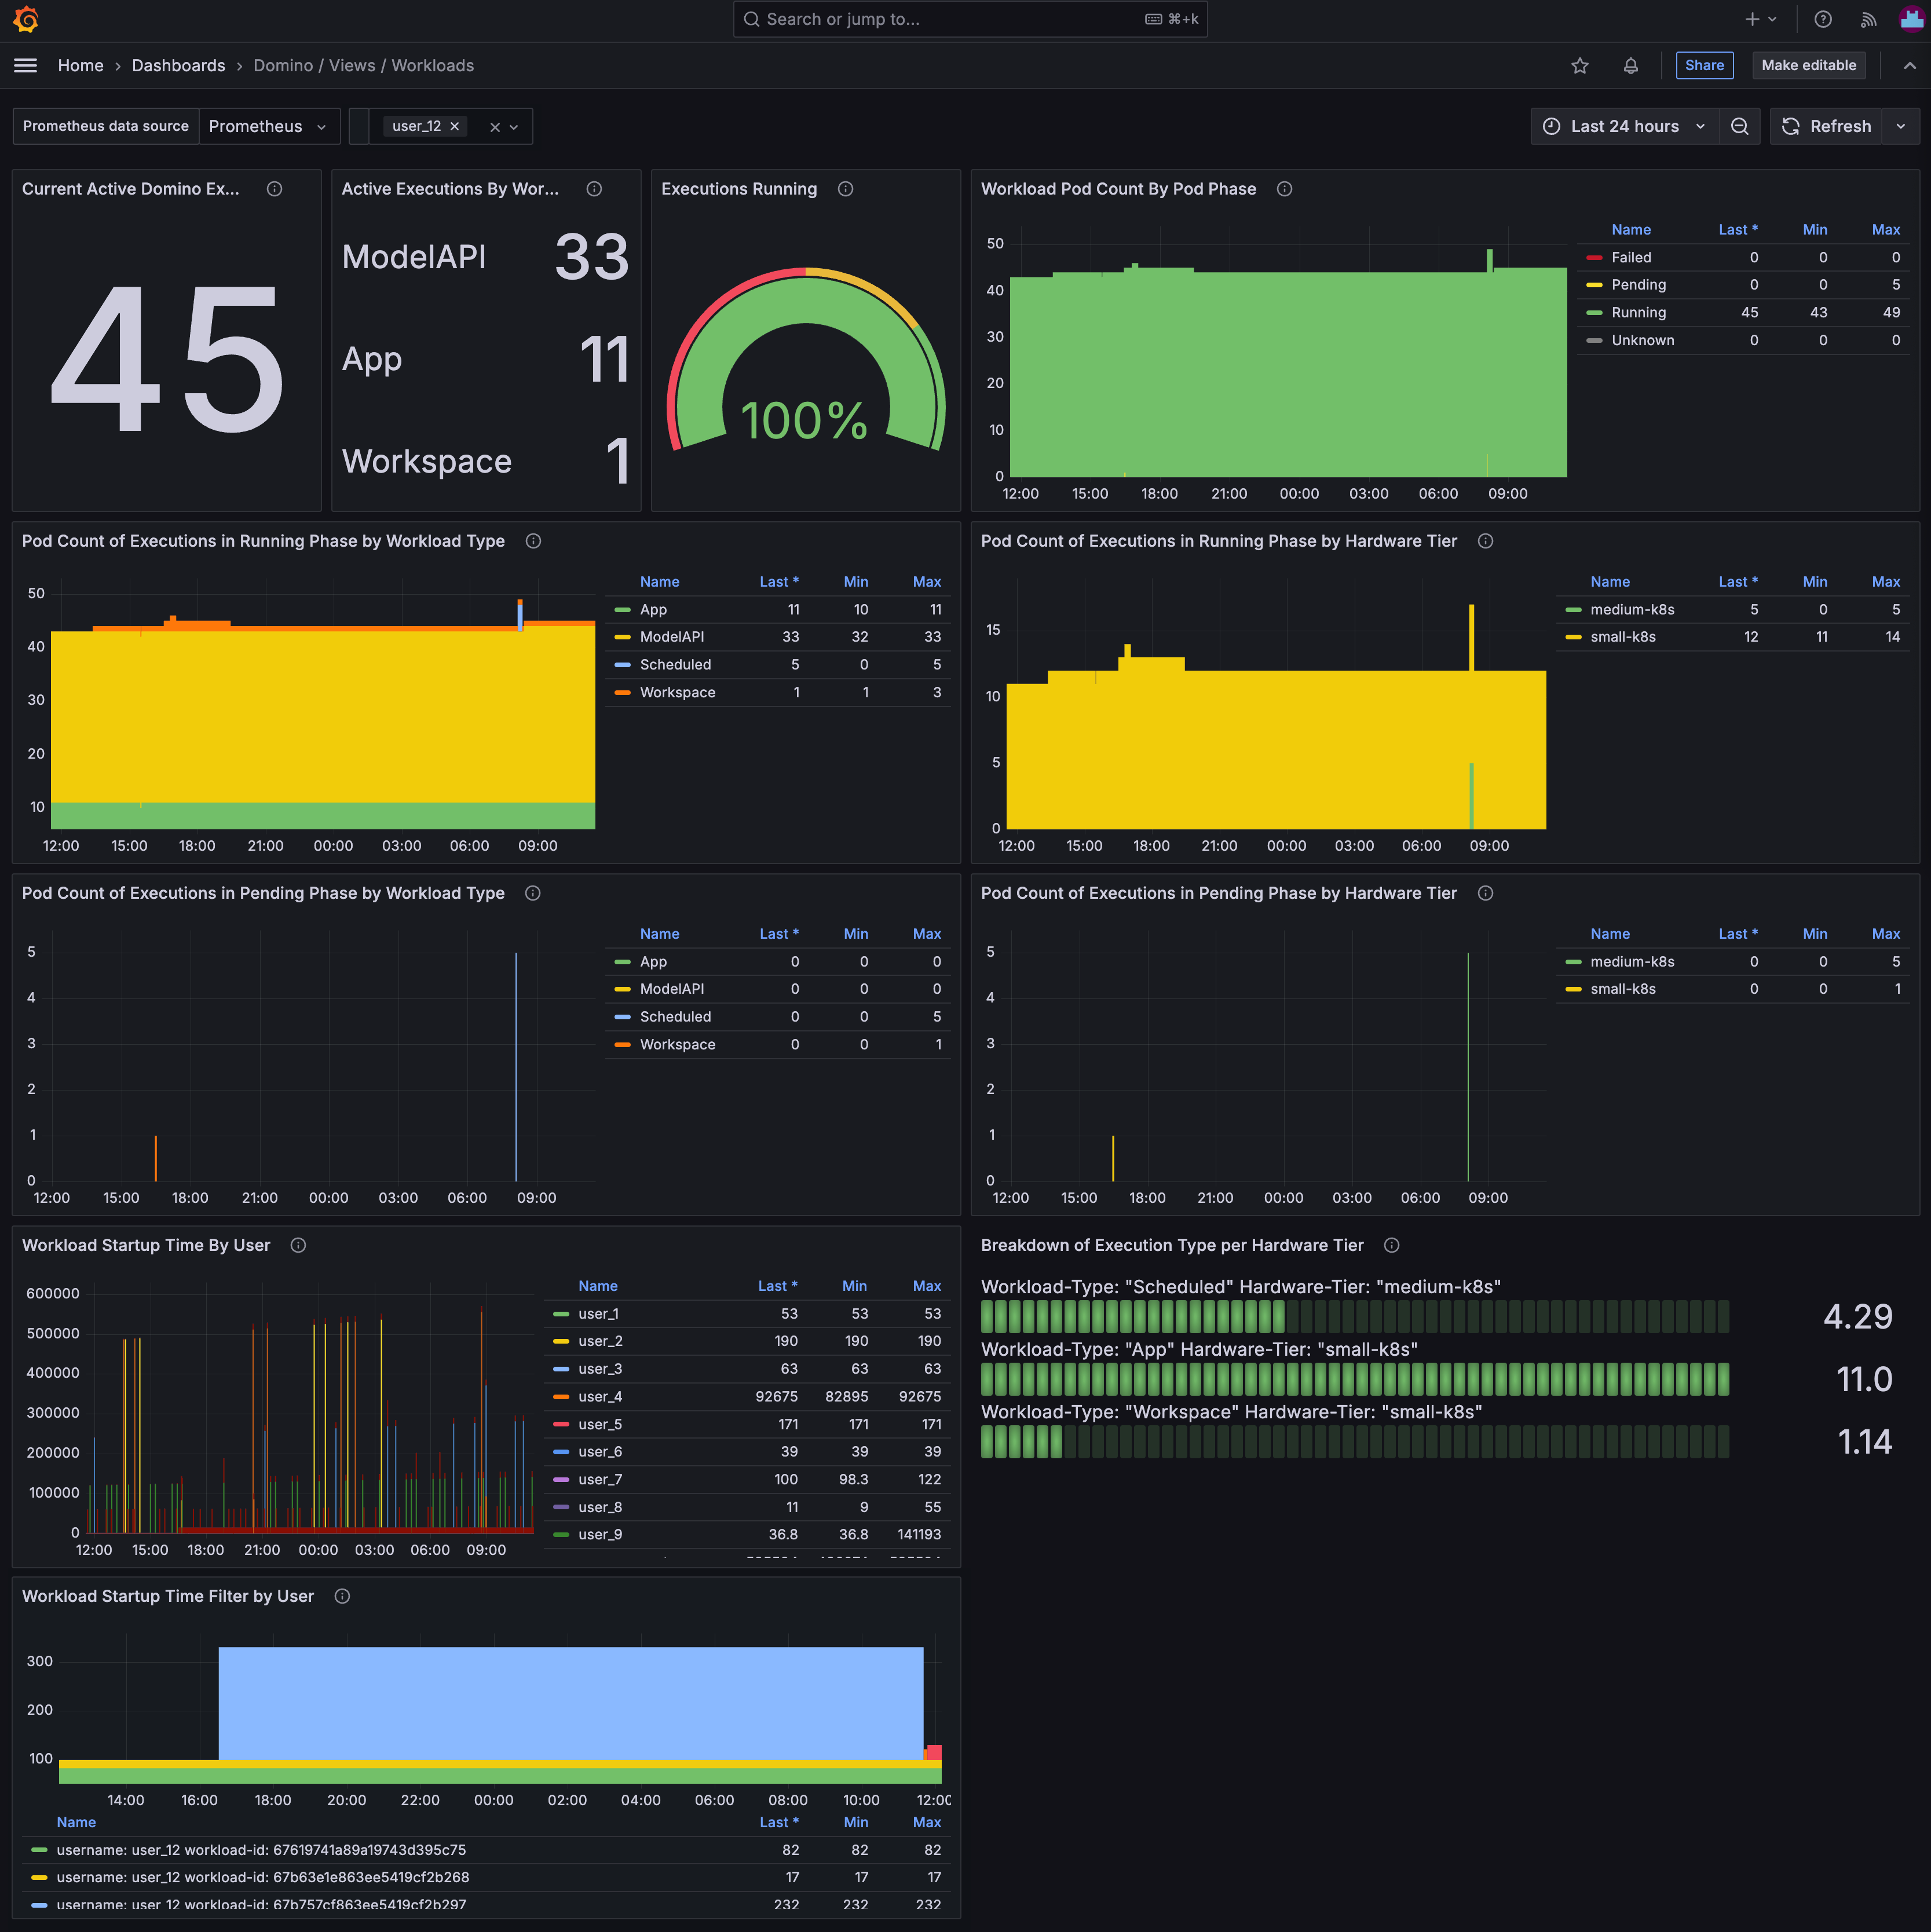
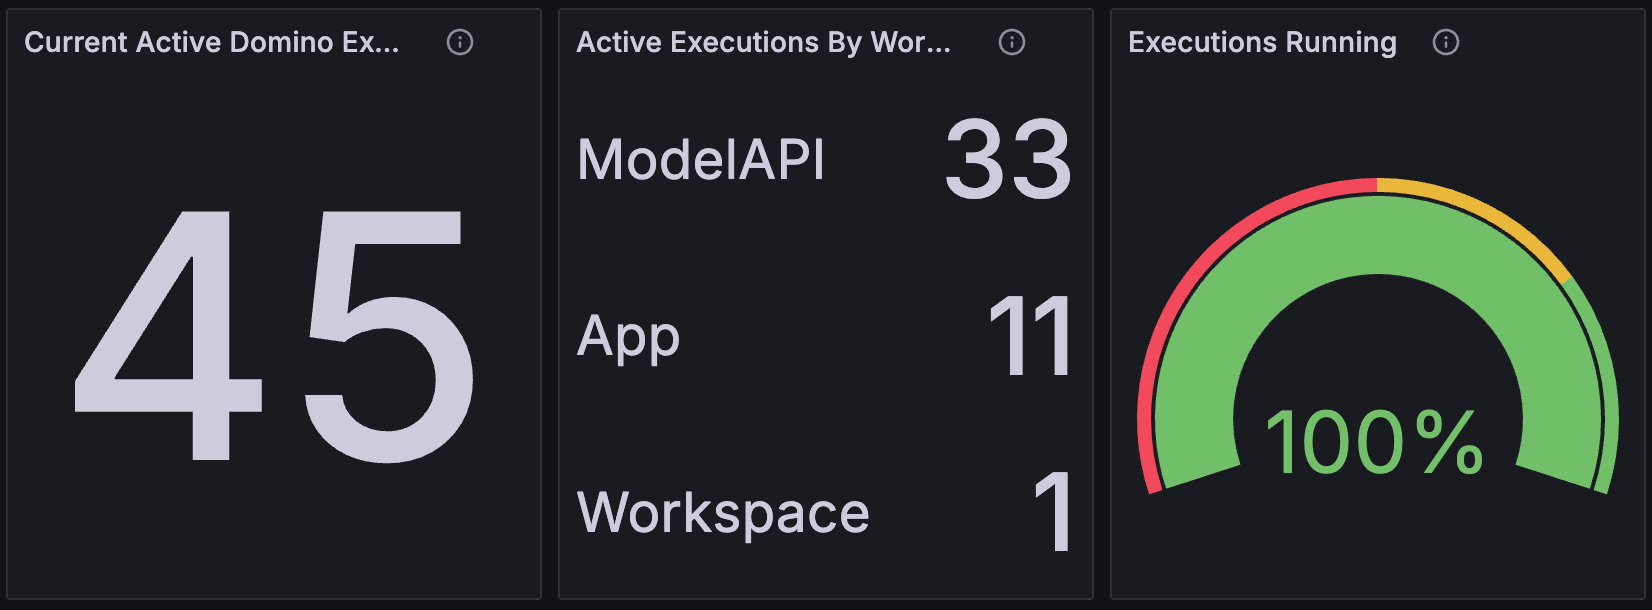
- The number of workloads of all types that are currently running on the Domino platform.
- A breakdown of the workloads by type.
- The ratio of workloads of all types in the running versus non-running state.
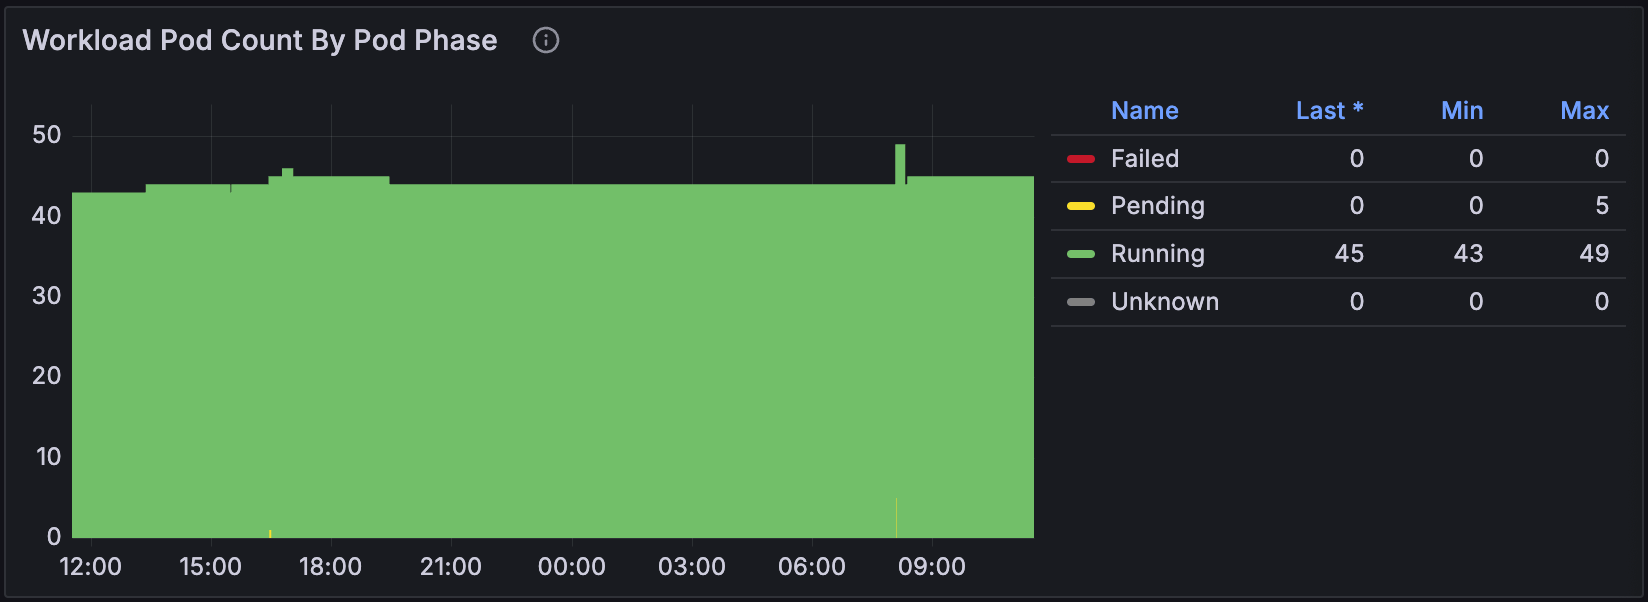
Pending, Running, Succeeded, and Failed. If many pods are in the Pending state, it might indicate that the Kubernetes cluster is under-provisioned. Lots of pods in the Failed state can indicate a problem with the workload itself or with the underlying infrastructure.
Pod Count of Executions in Running Phase by Workload Type | Pod Count of Executions in Running Phase by Hardware Tier

Running phase for each workload type and hardware tier. The first panel gives an indication of the distribution of workloads across different types, while the second panel shows how the workloads are distributed across different hardware tiers.
Pod Count of Executions in Pending Phase by Workload Type | Pod Count of Executions in Pending Phase by Hardware Tier

Running phase, these two panels show the number of workload pods in the Pending phase for each workload type and hardware tier. This can help you understand the distribution of workloads that are waiting to be scheduled and detect problems with starting particular workload types, or issues with certain hardware tiers. On busy deployments a workload pod must wait for the cluster autoscaler to provision a node before it can be scheduled, so many pods in the Pending state can indicate that the cluster is under-provisioned.
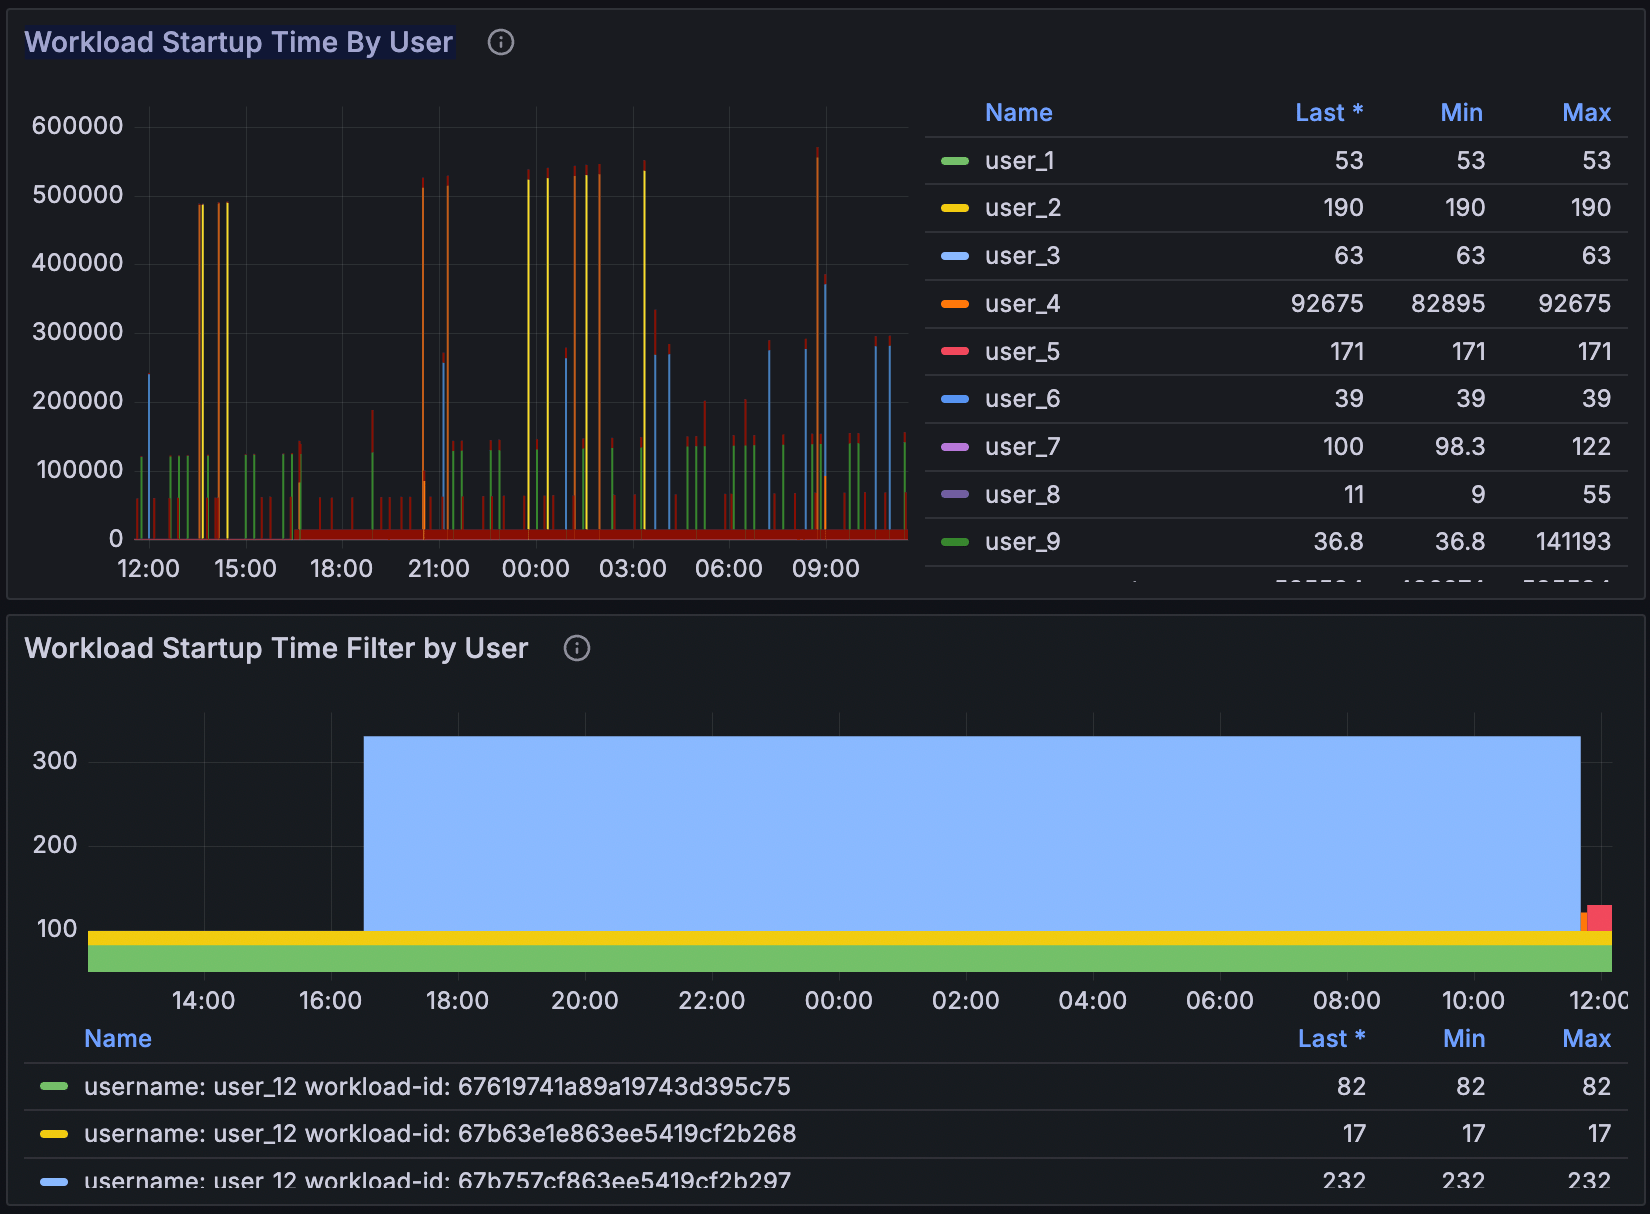
Workload Startup Time By User | Workload Startup Time Filter by User

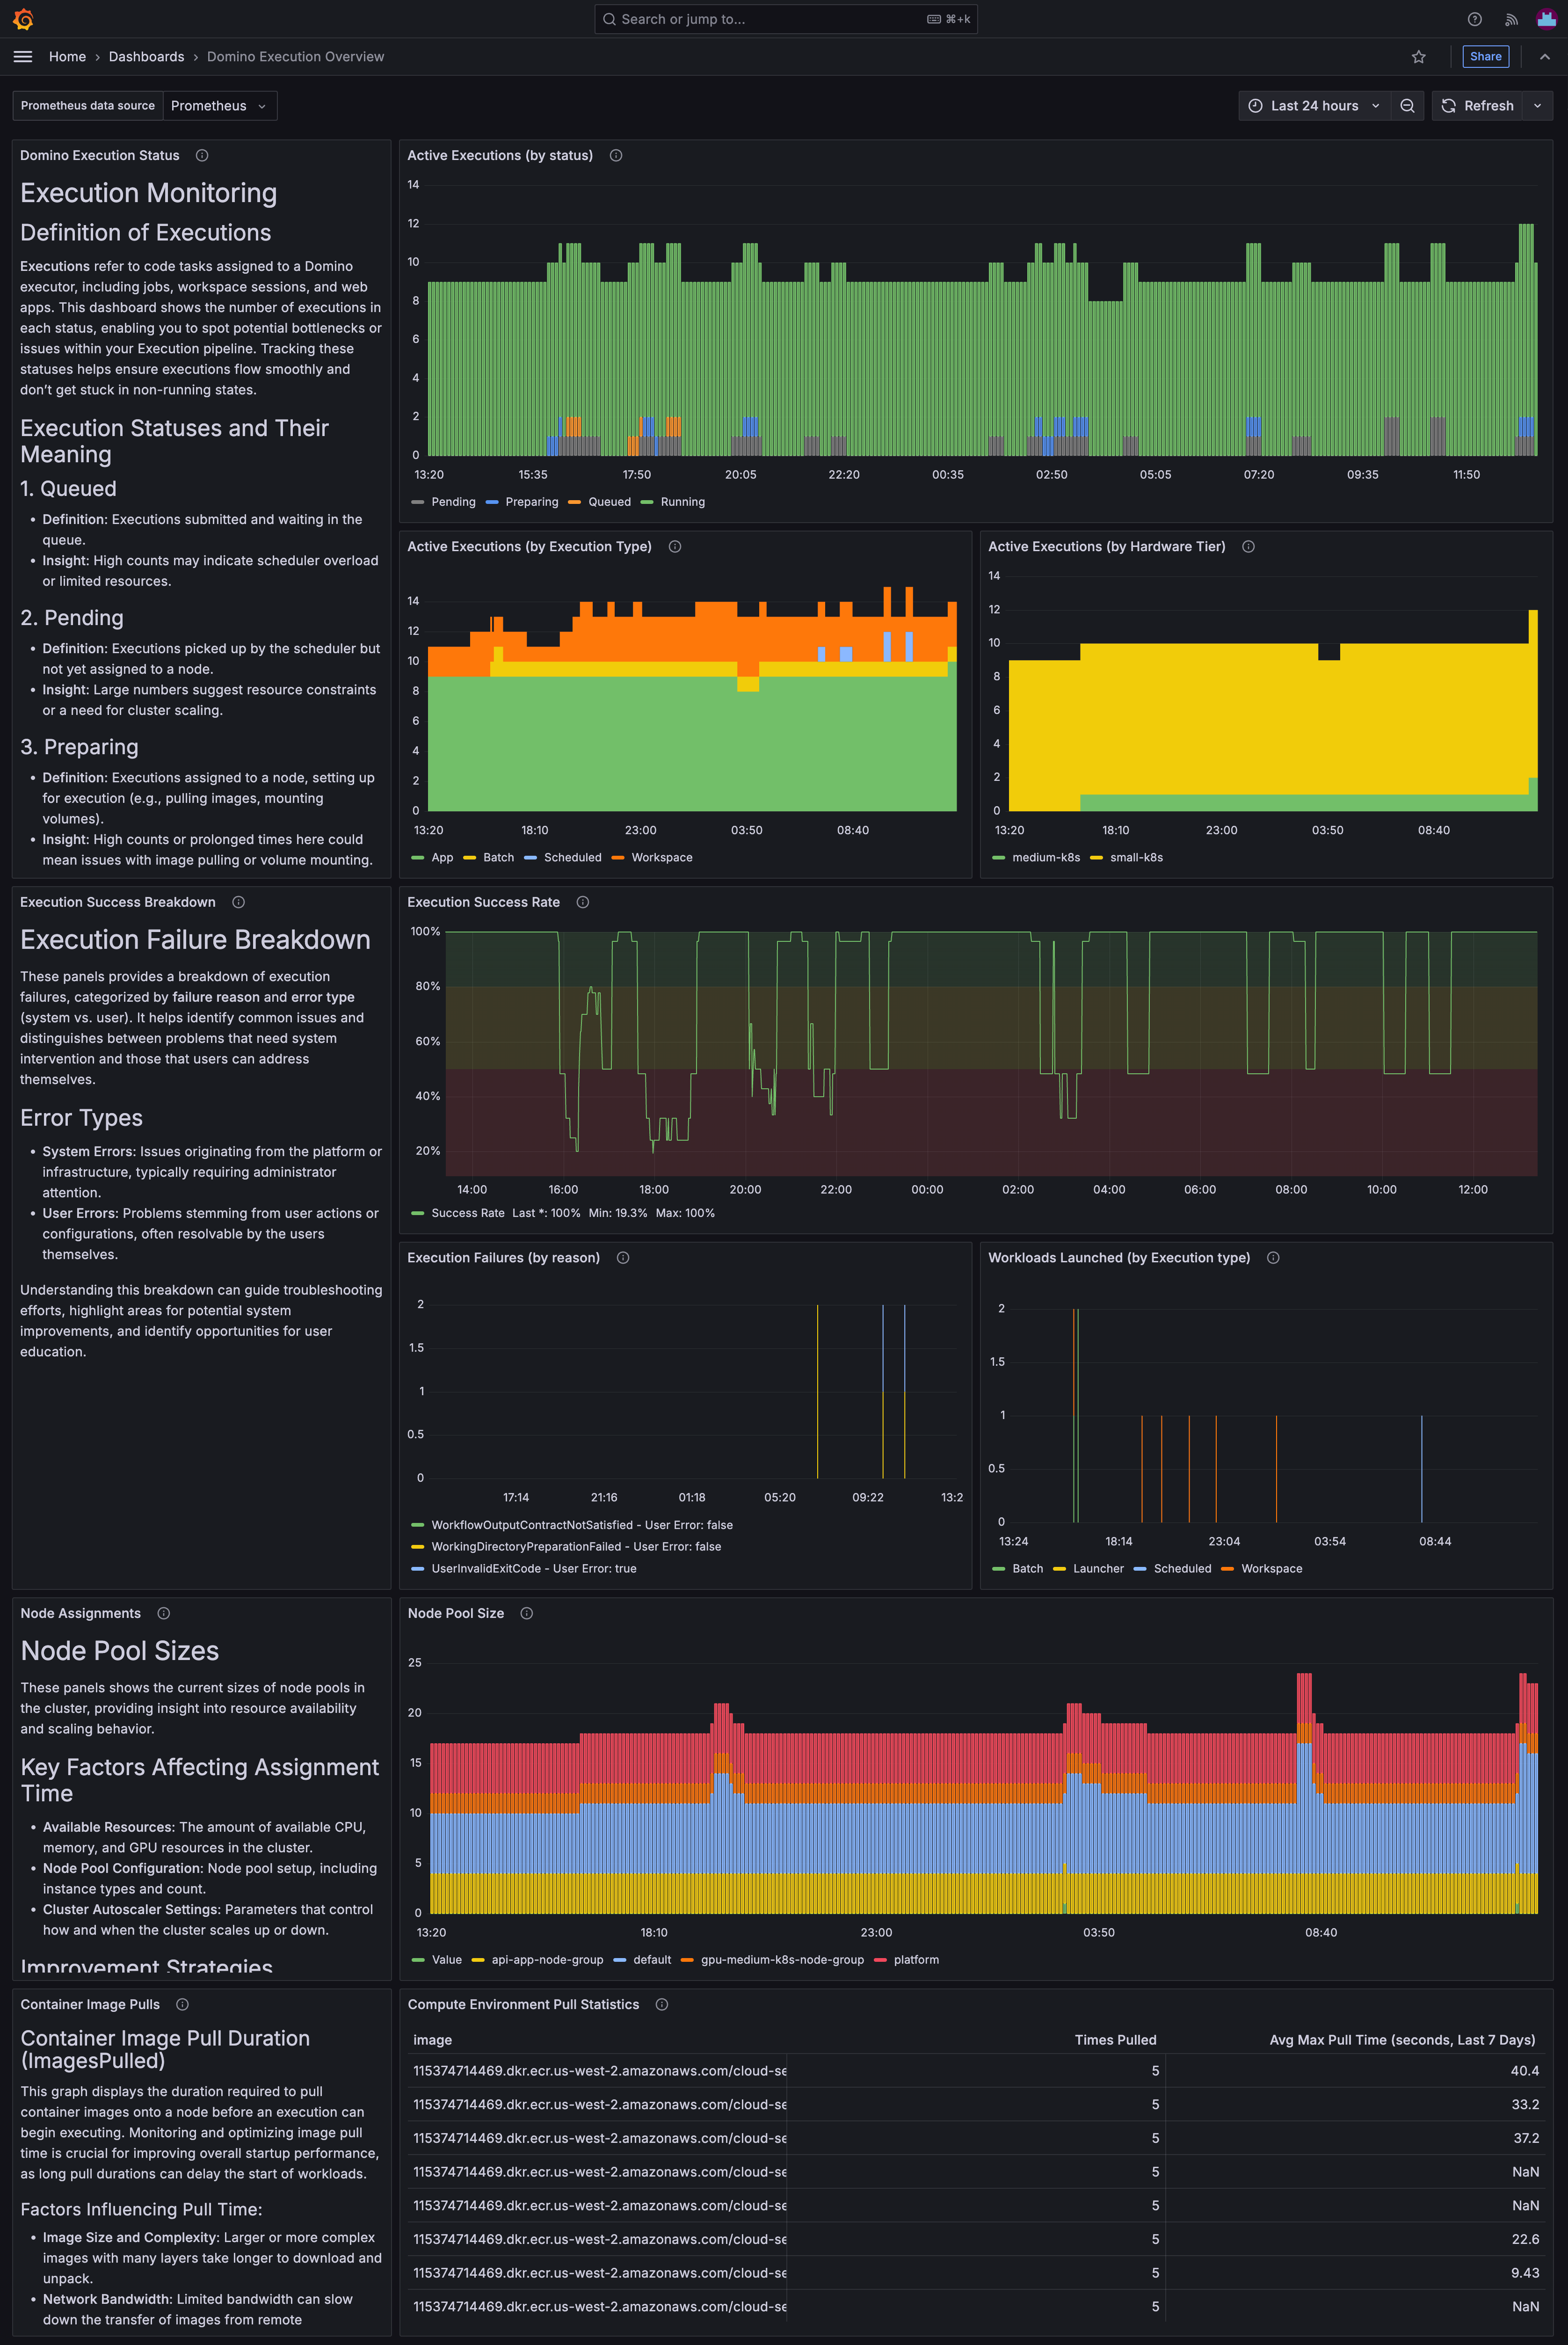
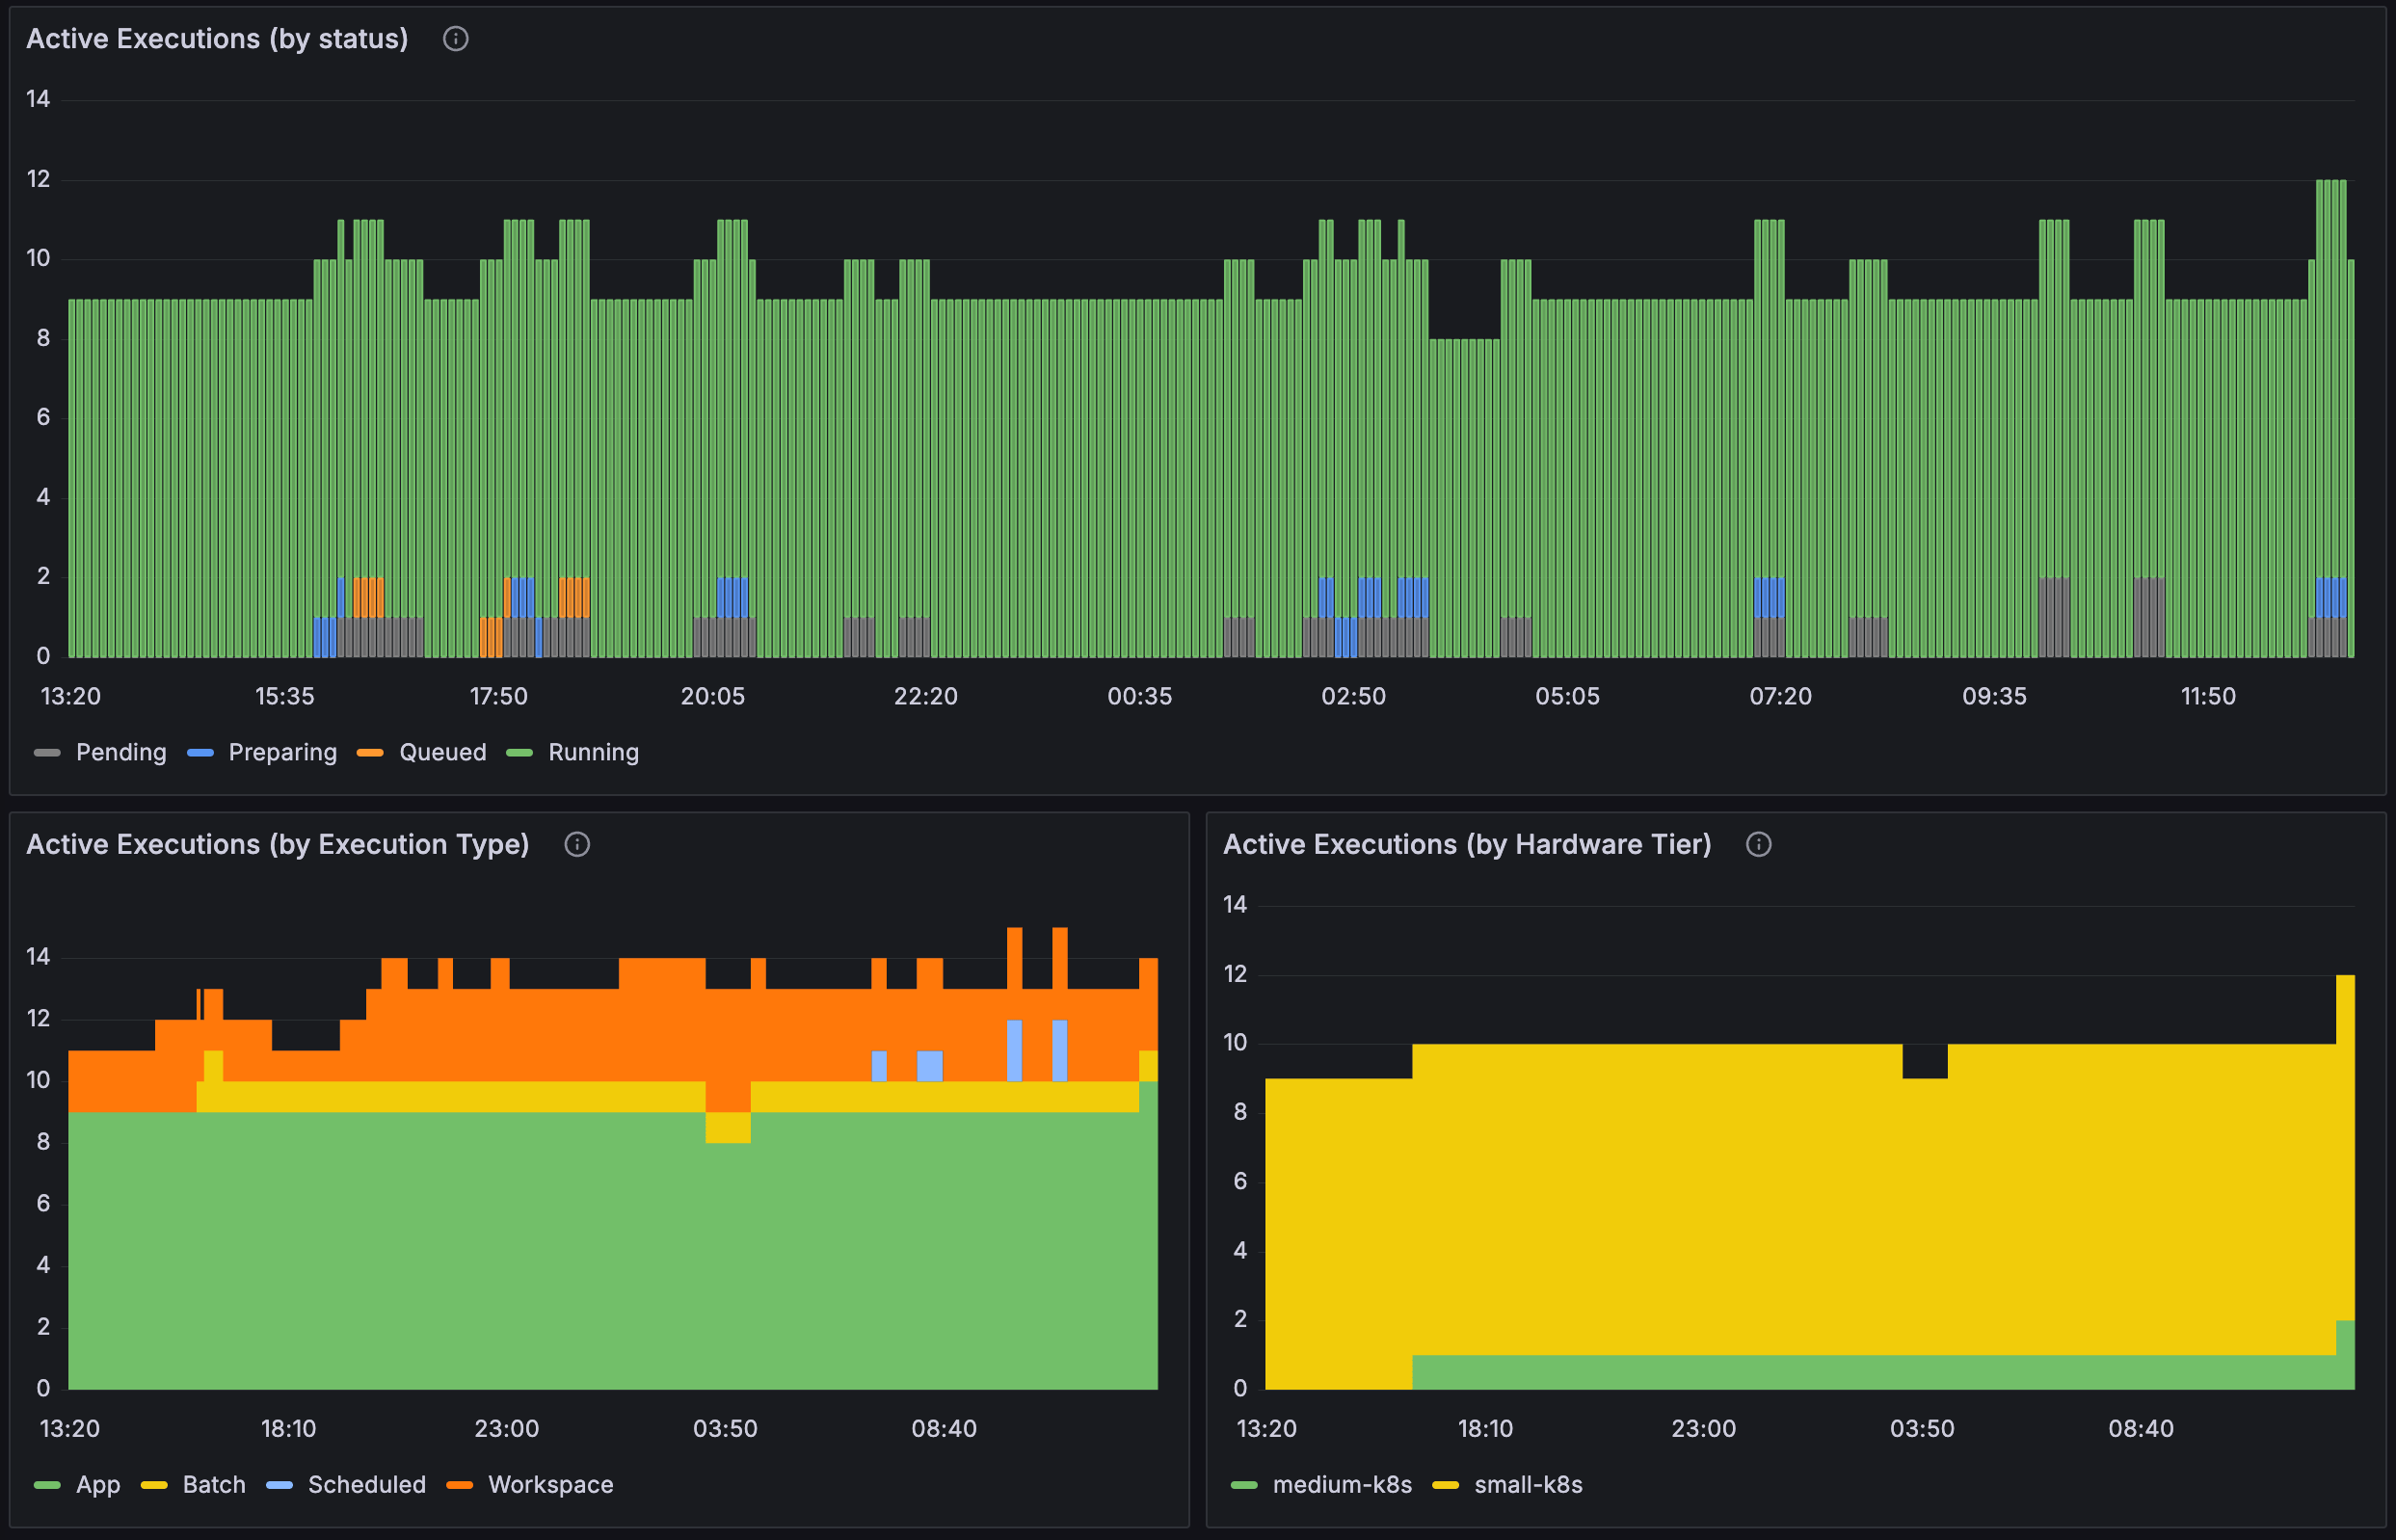
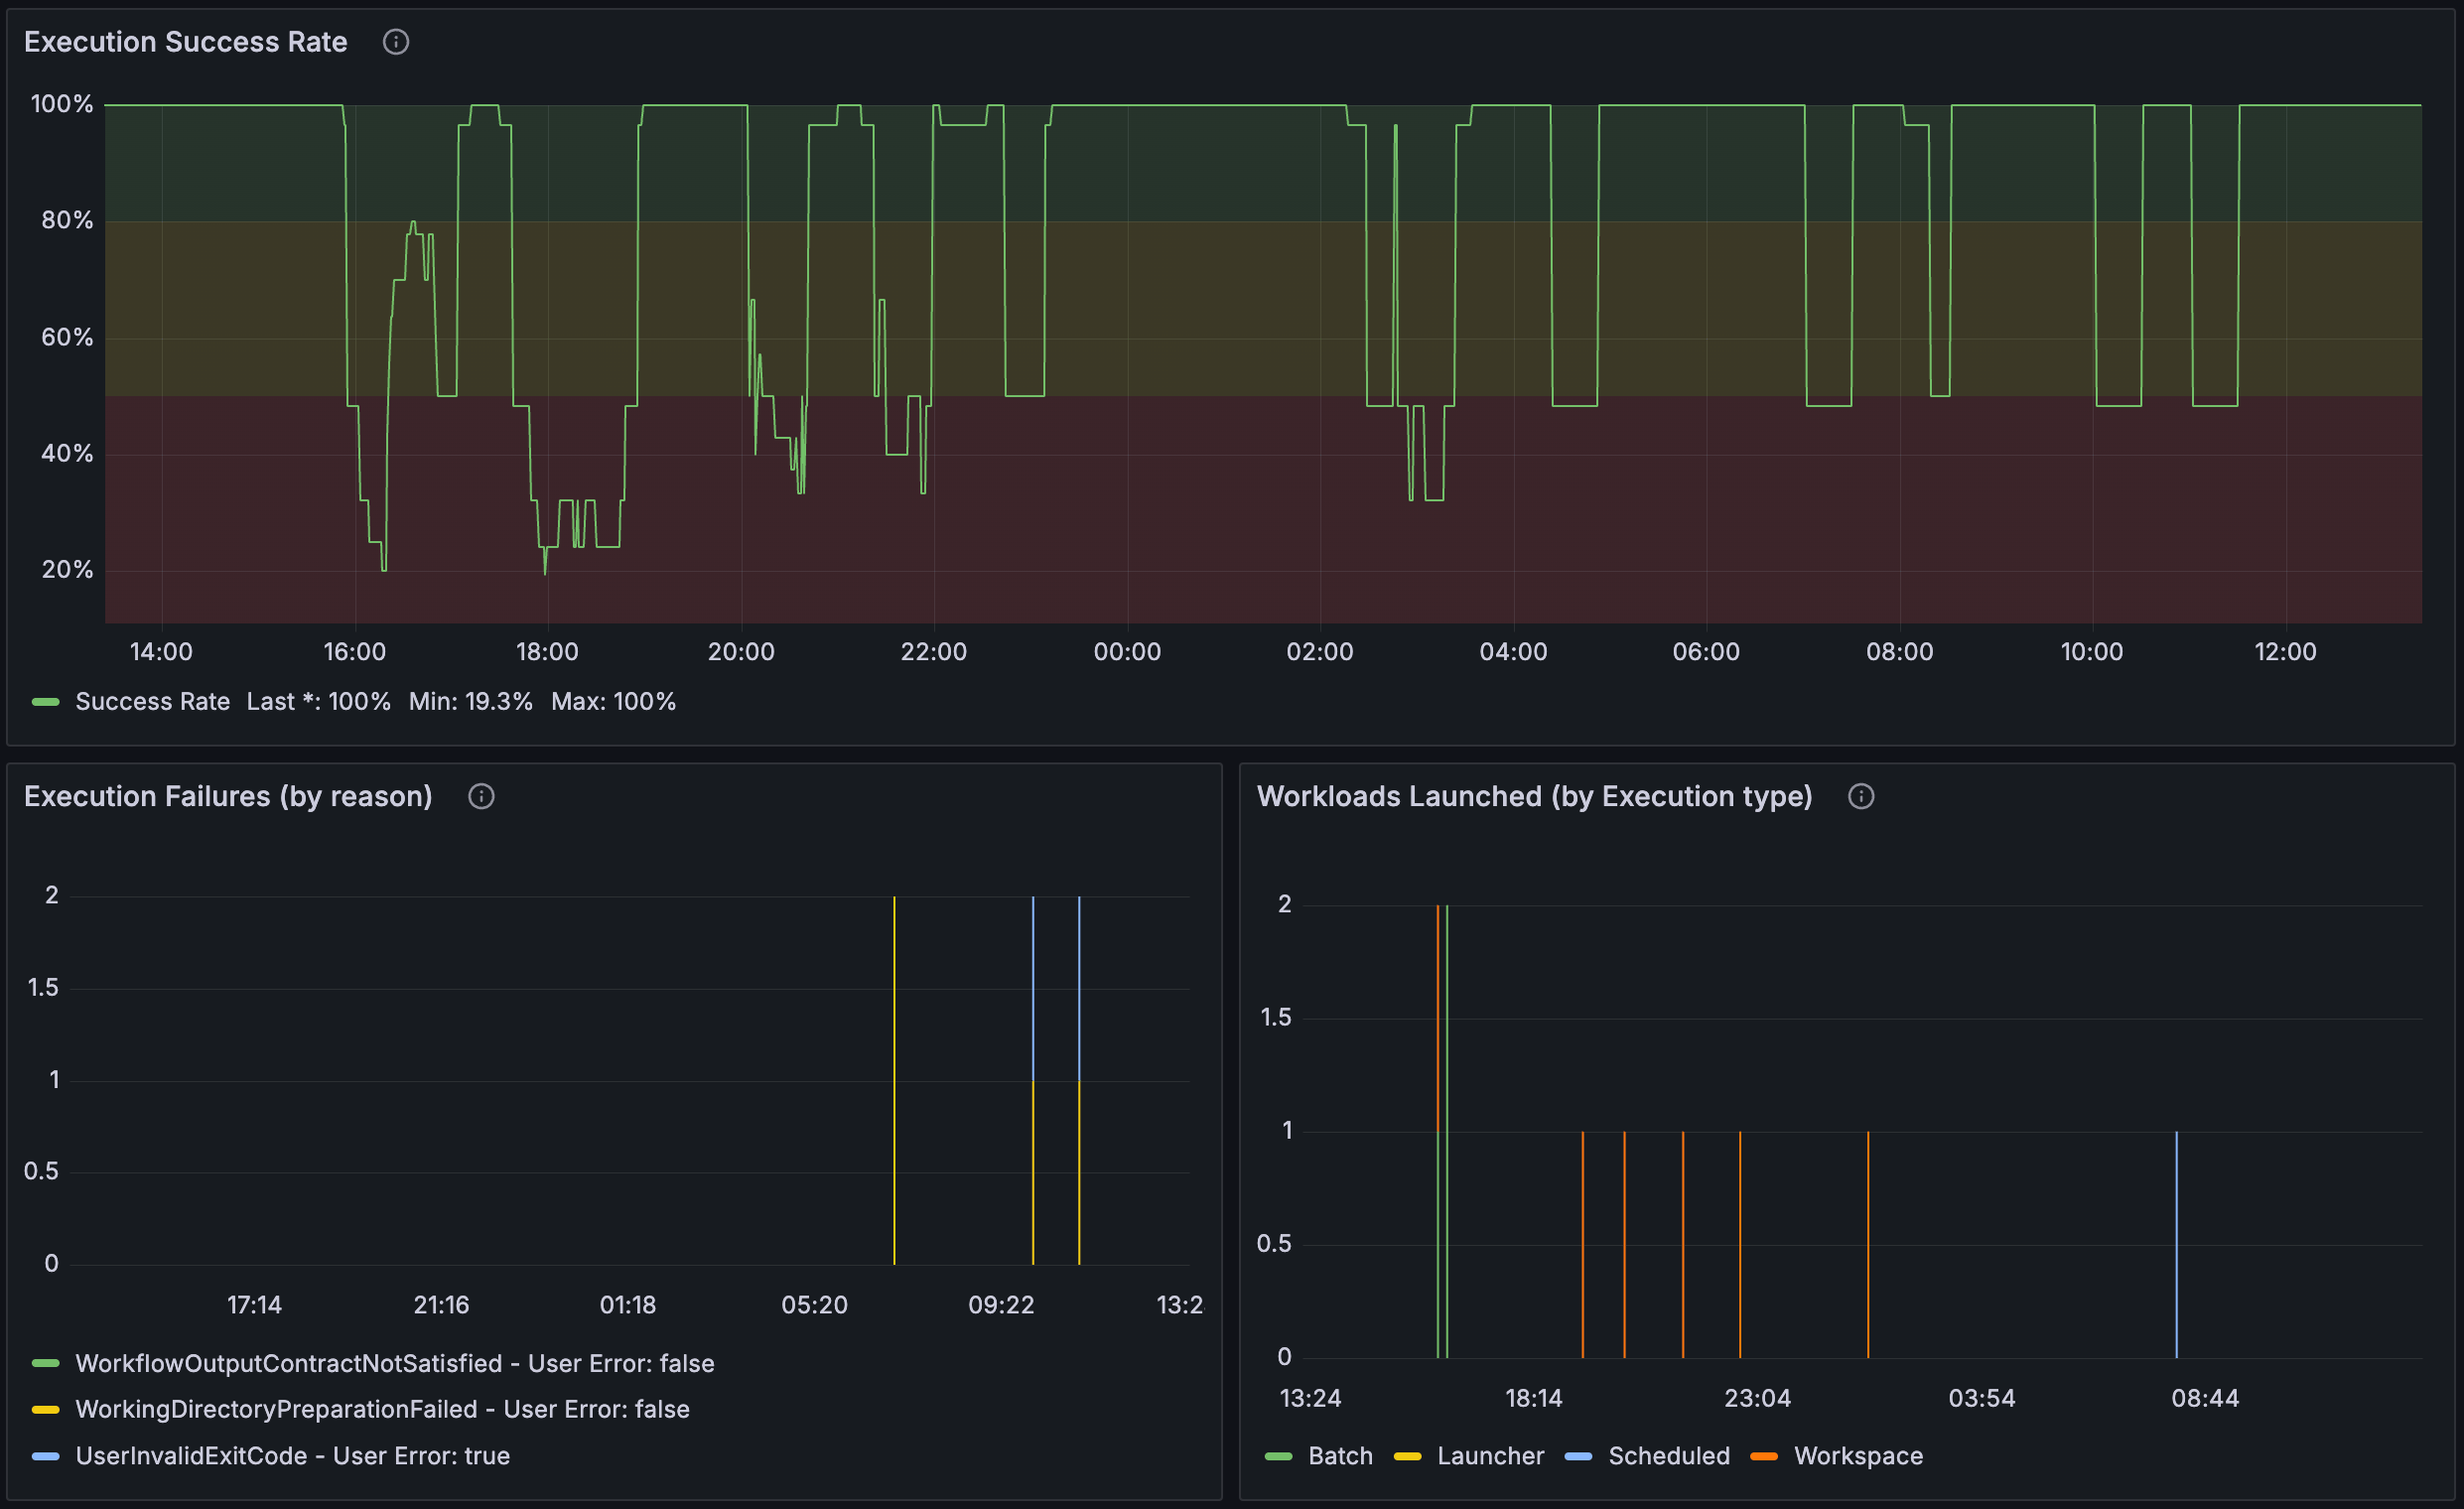
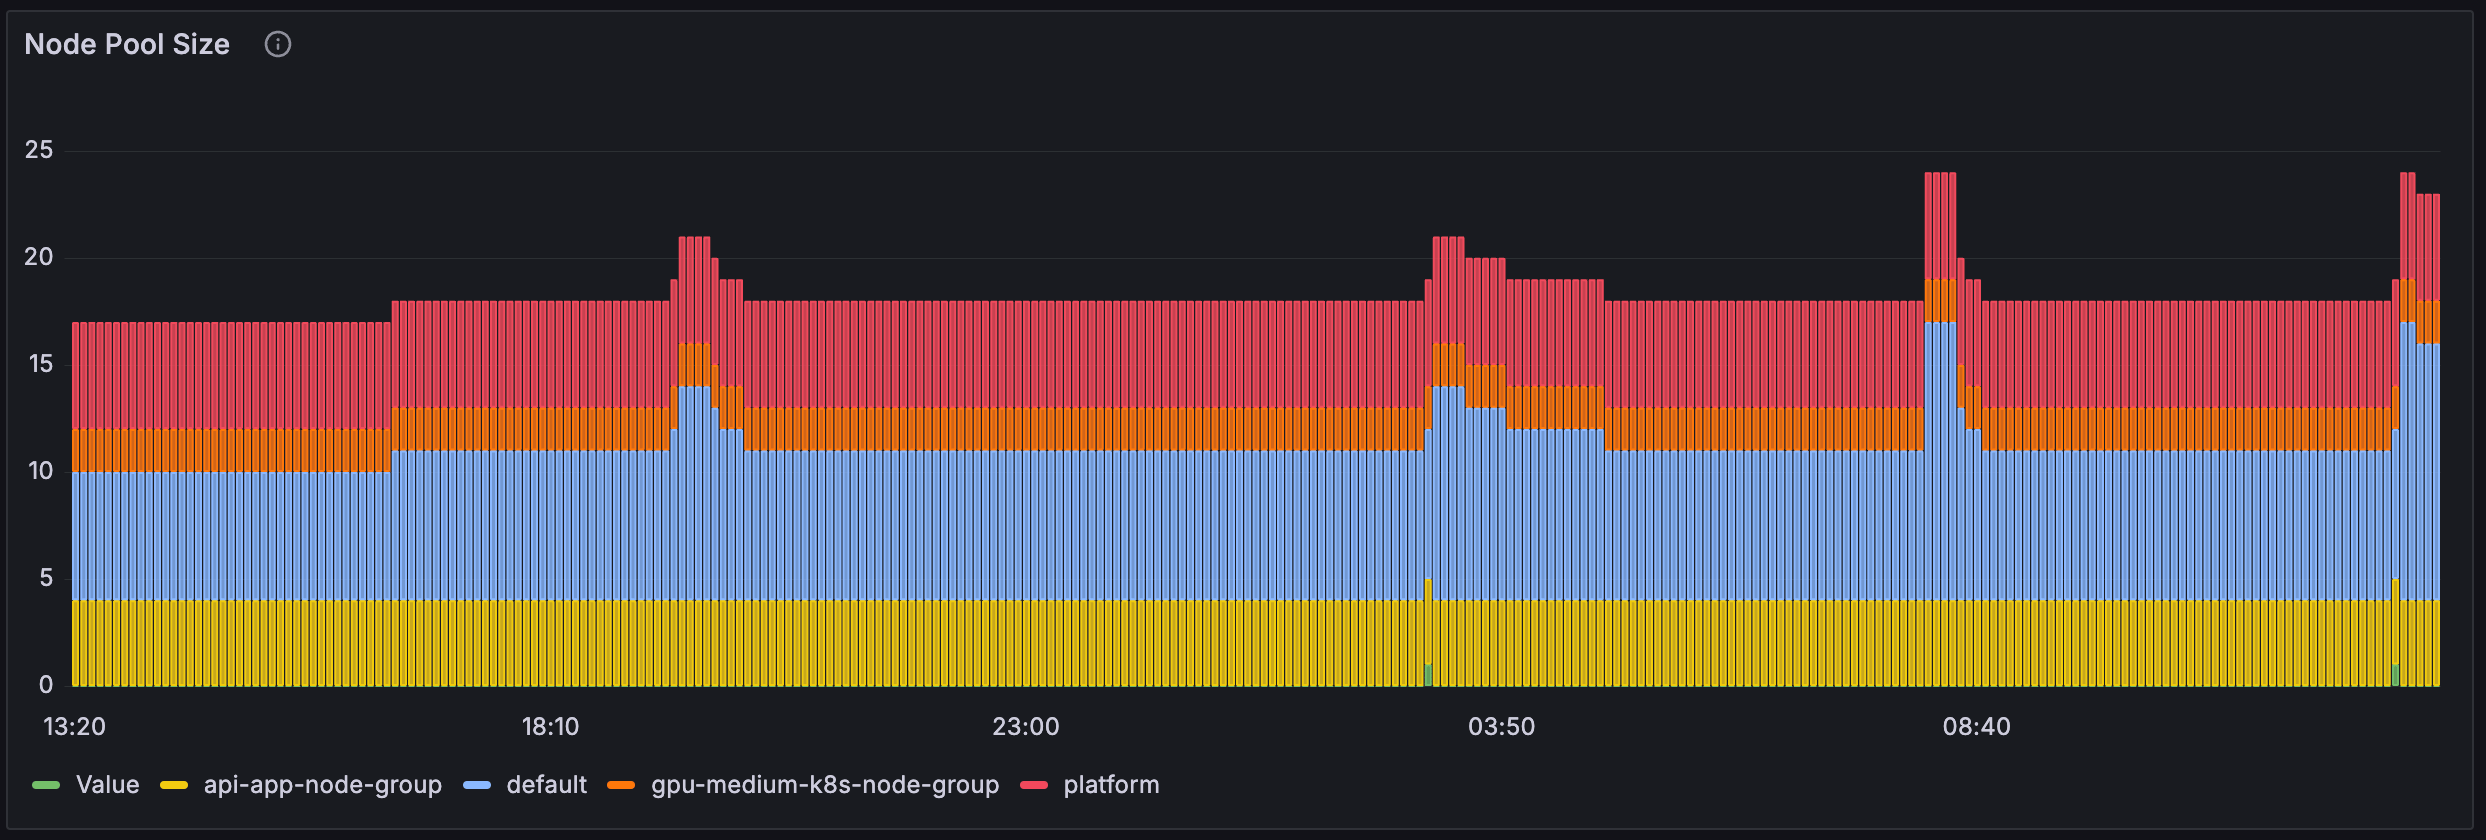
Domino Execution Overview
Example of the Domino Execution Overview dashboard
Example of the Domino Execution Overview dashboard
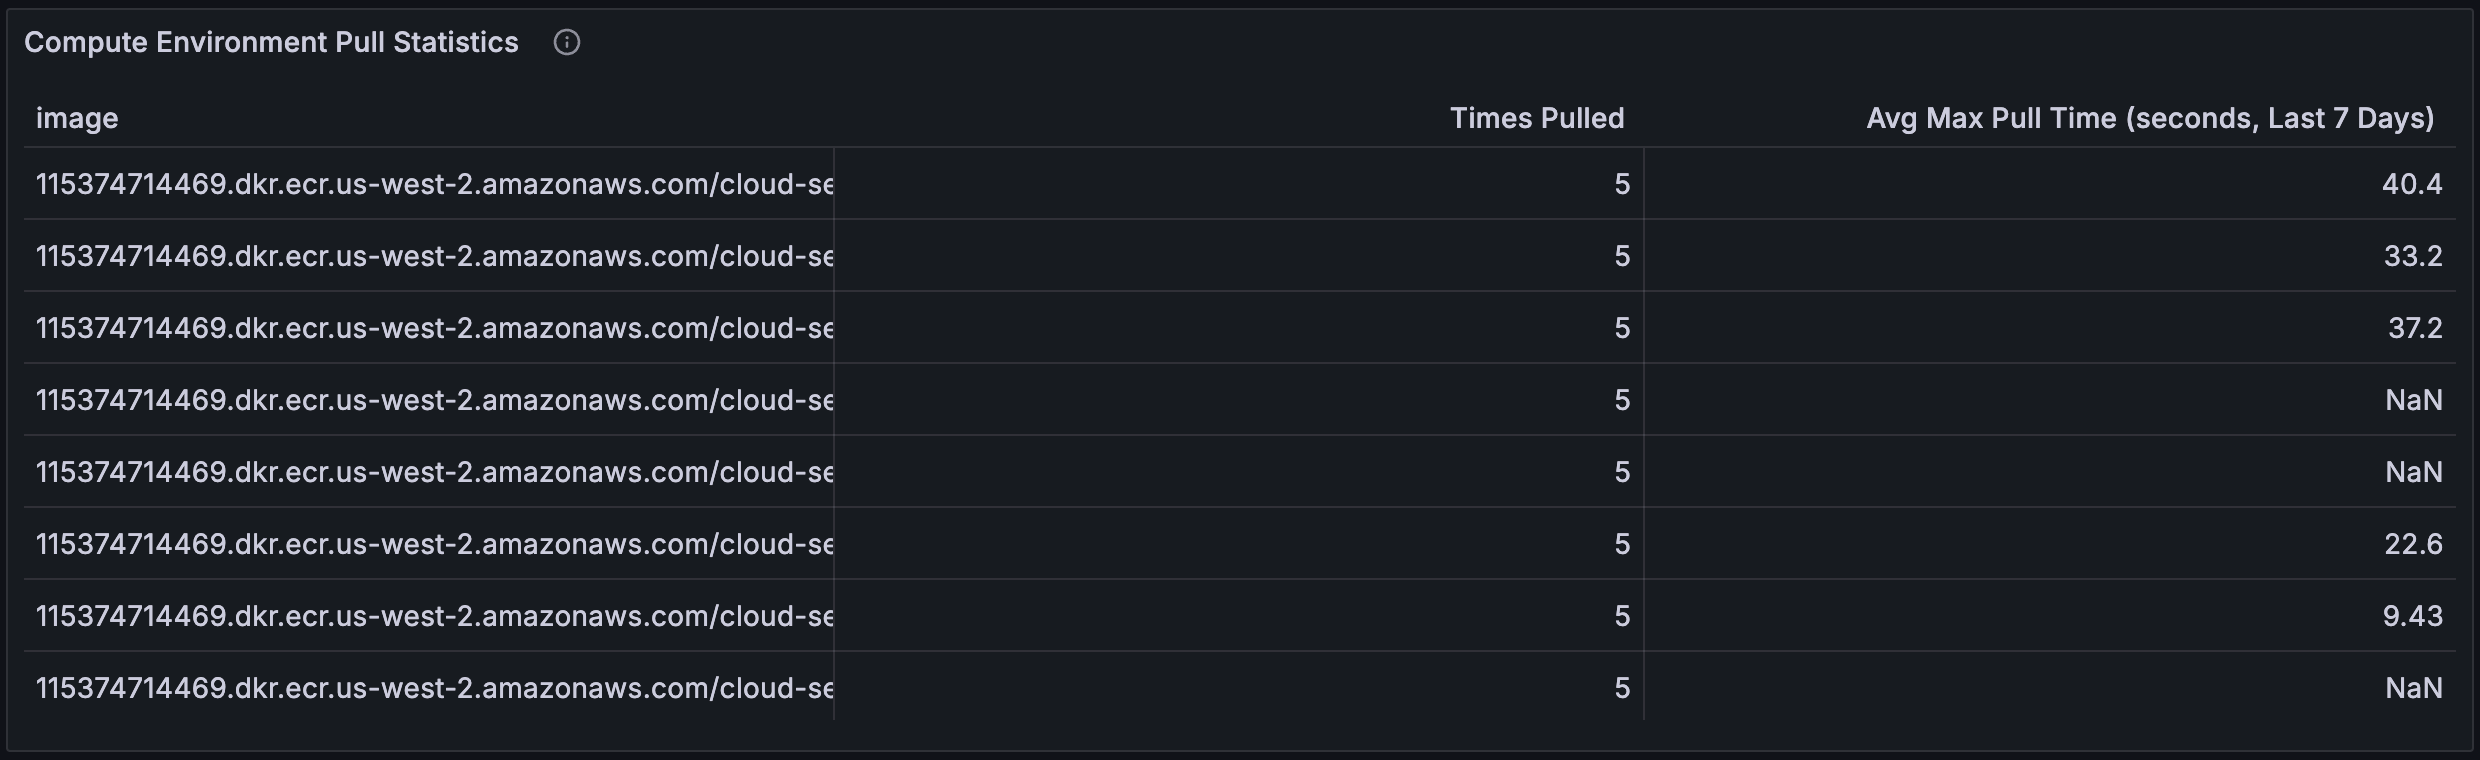
NGINX Ingress Controller
Example of the NGINX Ingress Controller dashboard
Example of the NGINX Ingress Controller dashboard
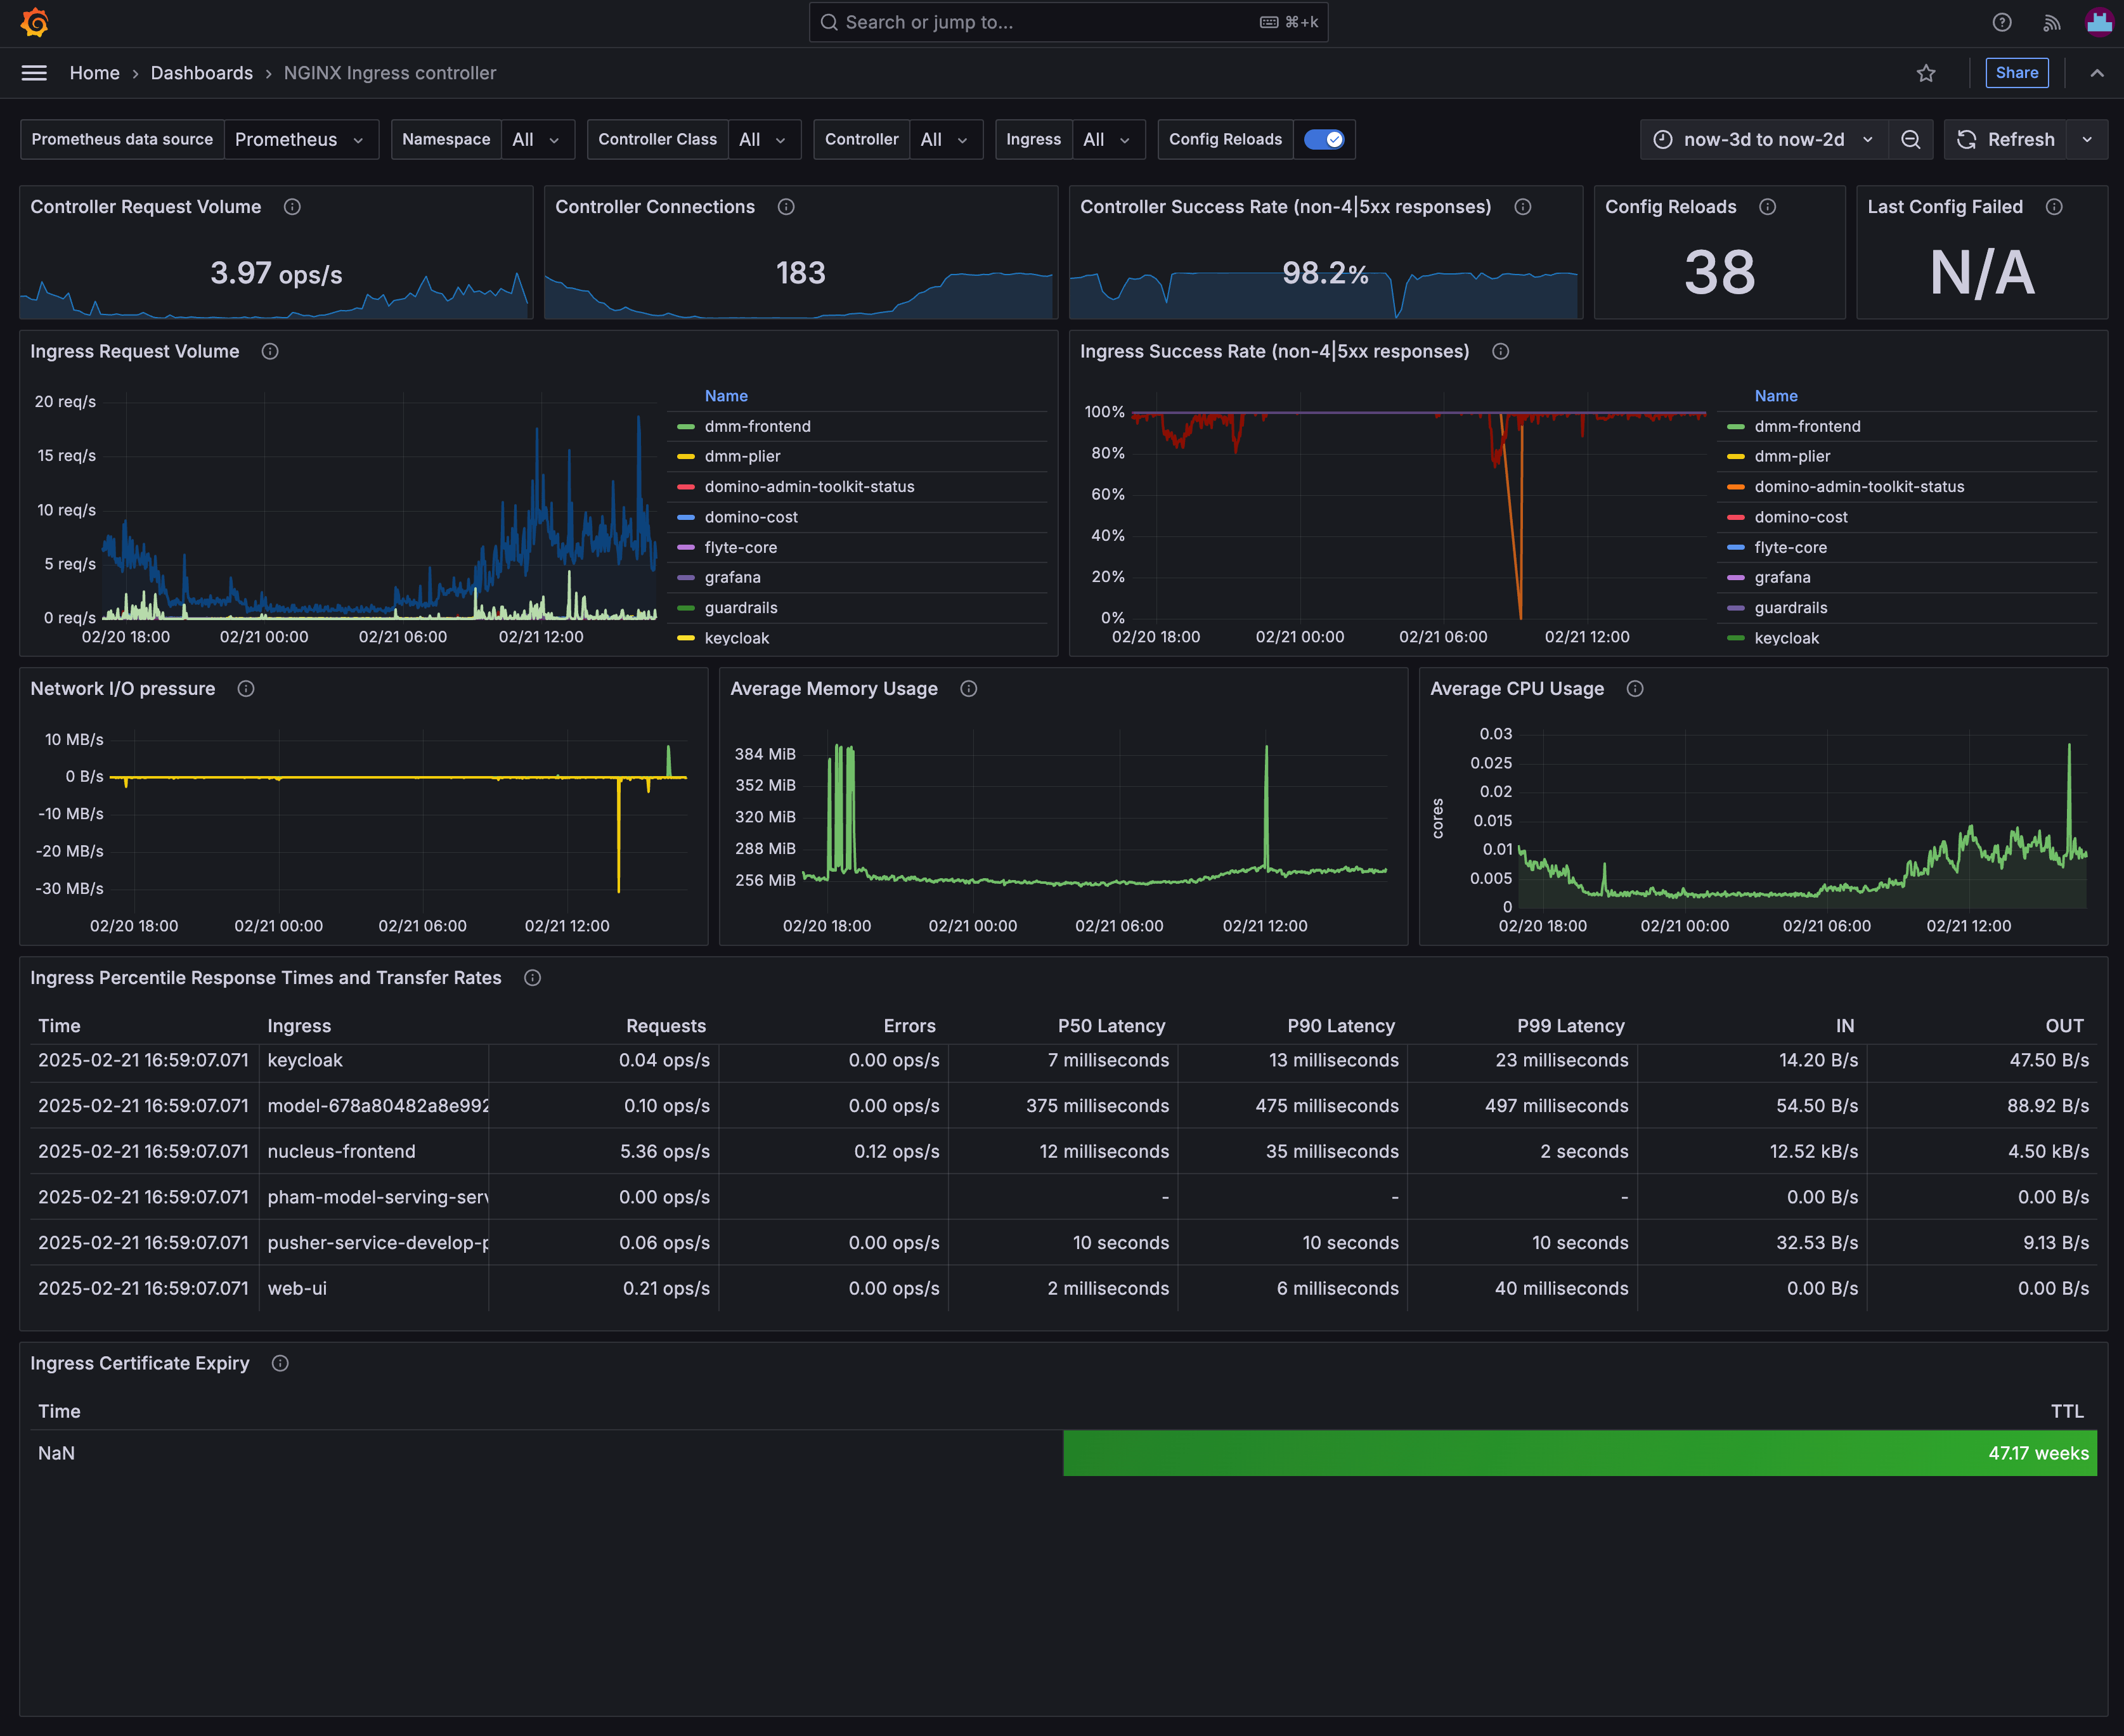

Config Reloads filter, when selected, displays metrics across all configuration changes for the selected controller. Deselecting this only shows metrics since the last configuration change.
Controller Request Volume | Controller Connections

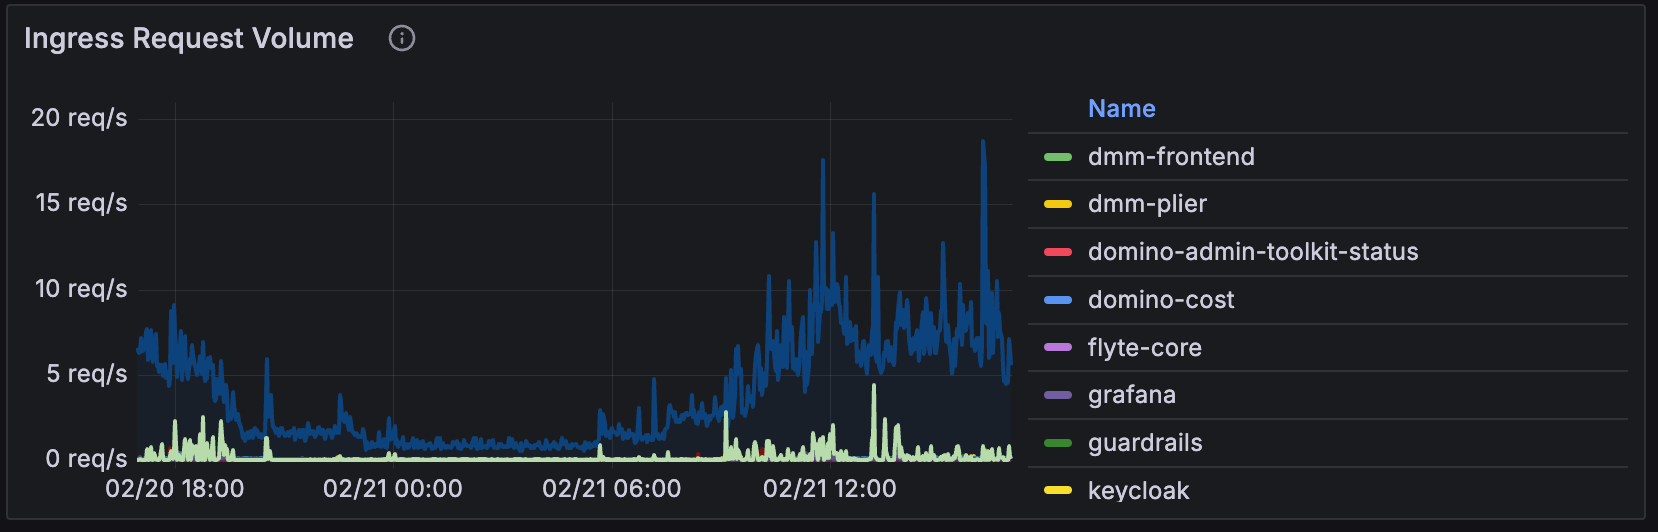
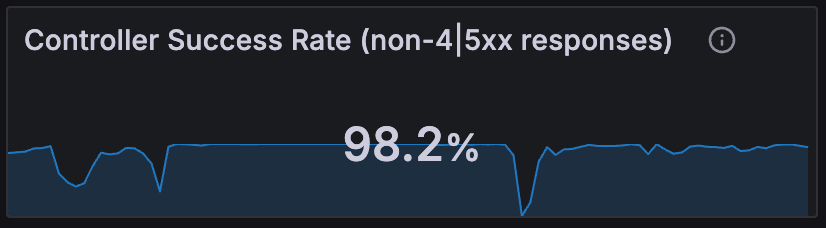
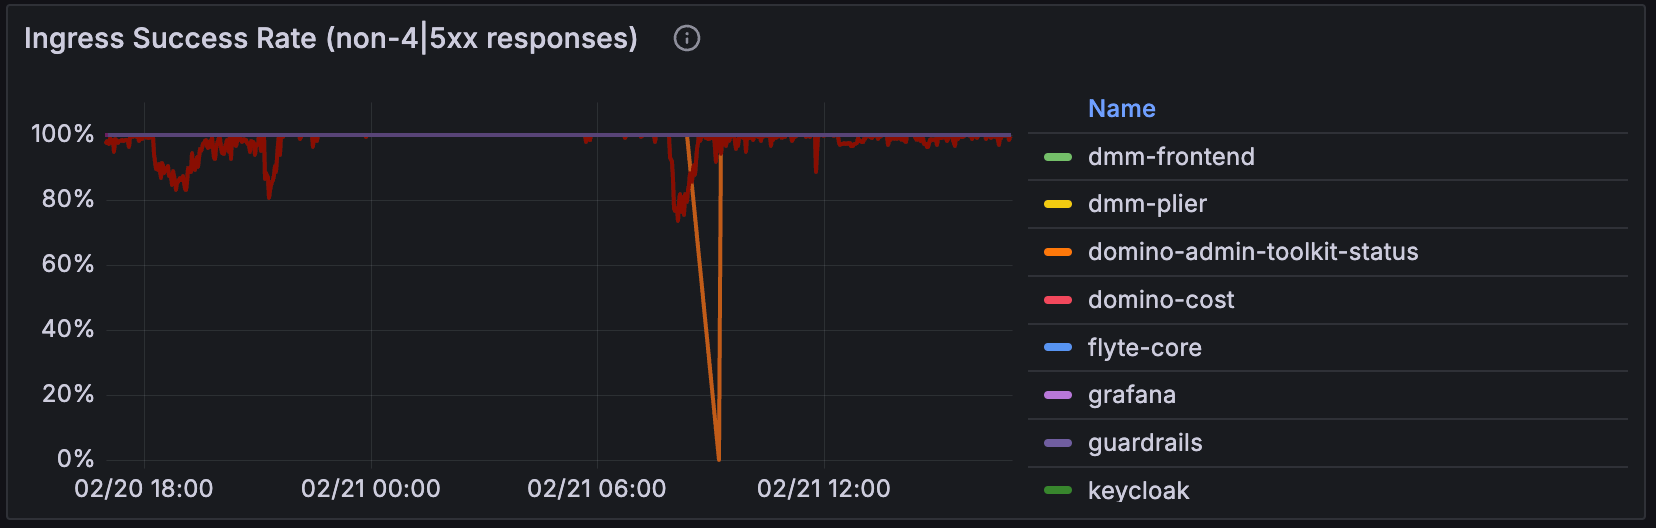
Ingress Success Rate panel shows the success rate per route for more detailed investigation.
Ingress Success Rate


Kubernetes / System / Cluster Autoscaler
Example of the Kubernetes / System / Cluster Autoscaler dashboard
Example of the Kubernetes / System / Cluster Autoscaler dashboard
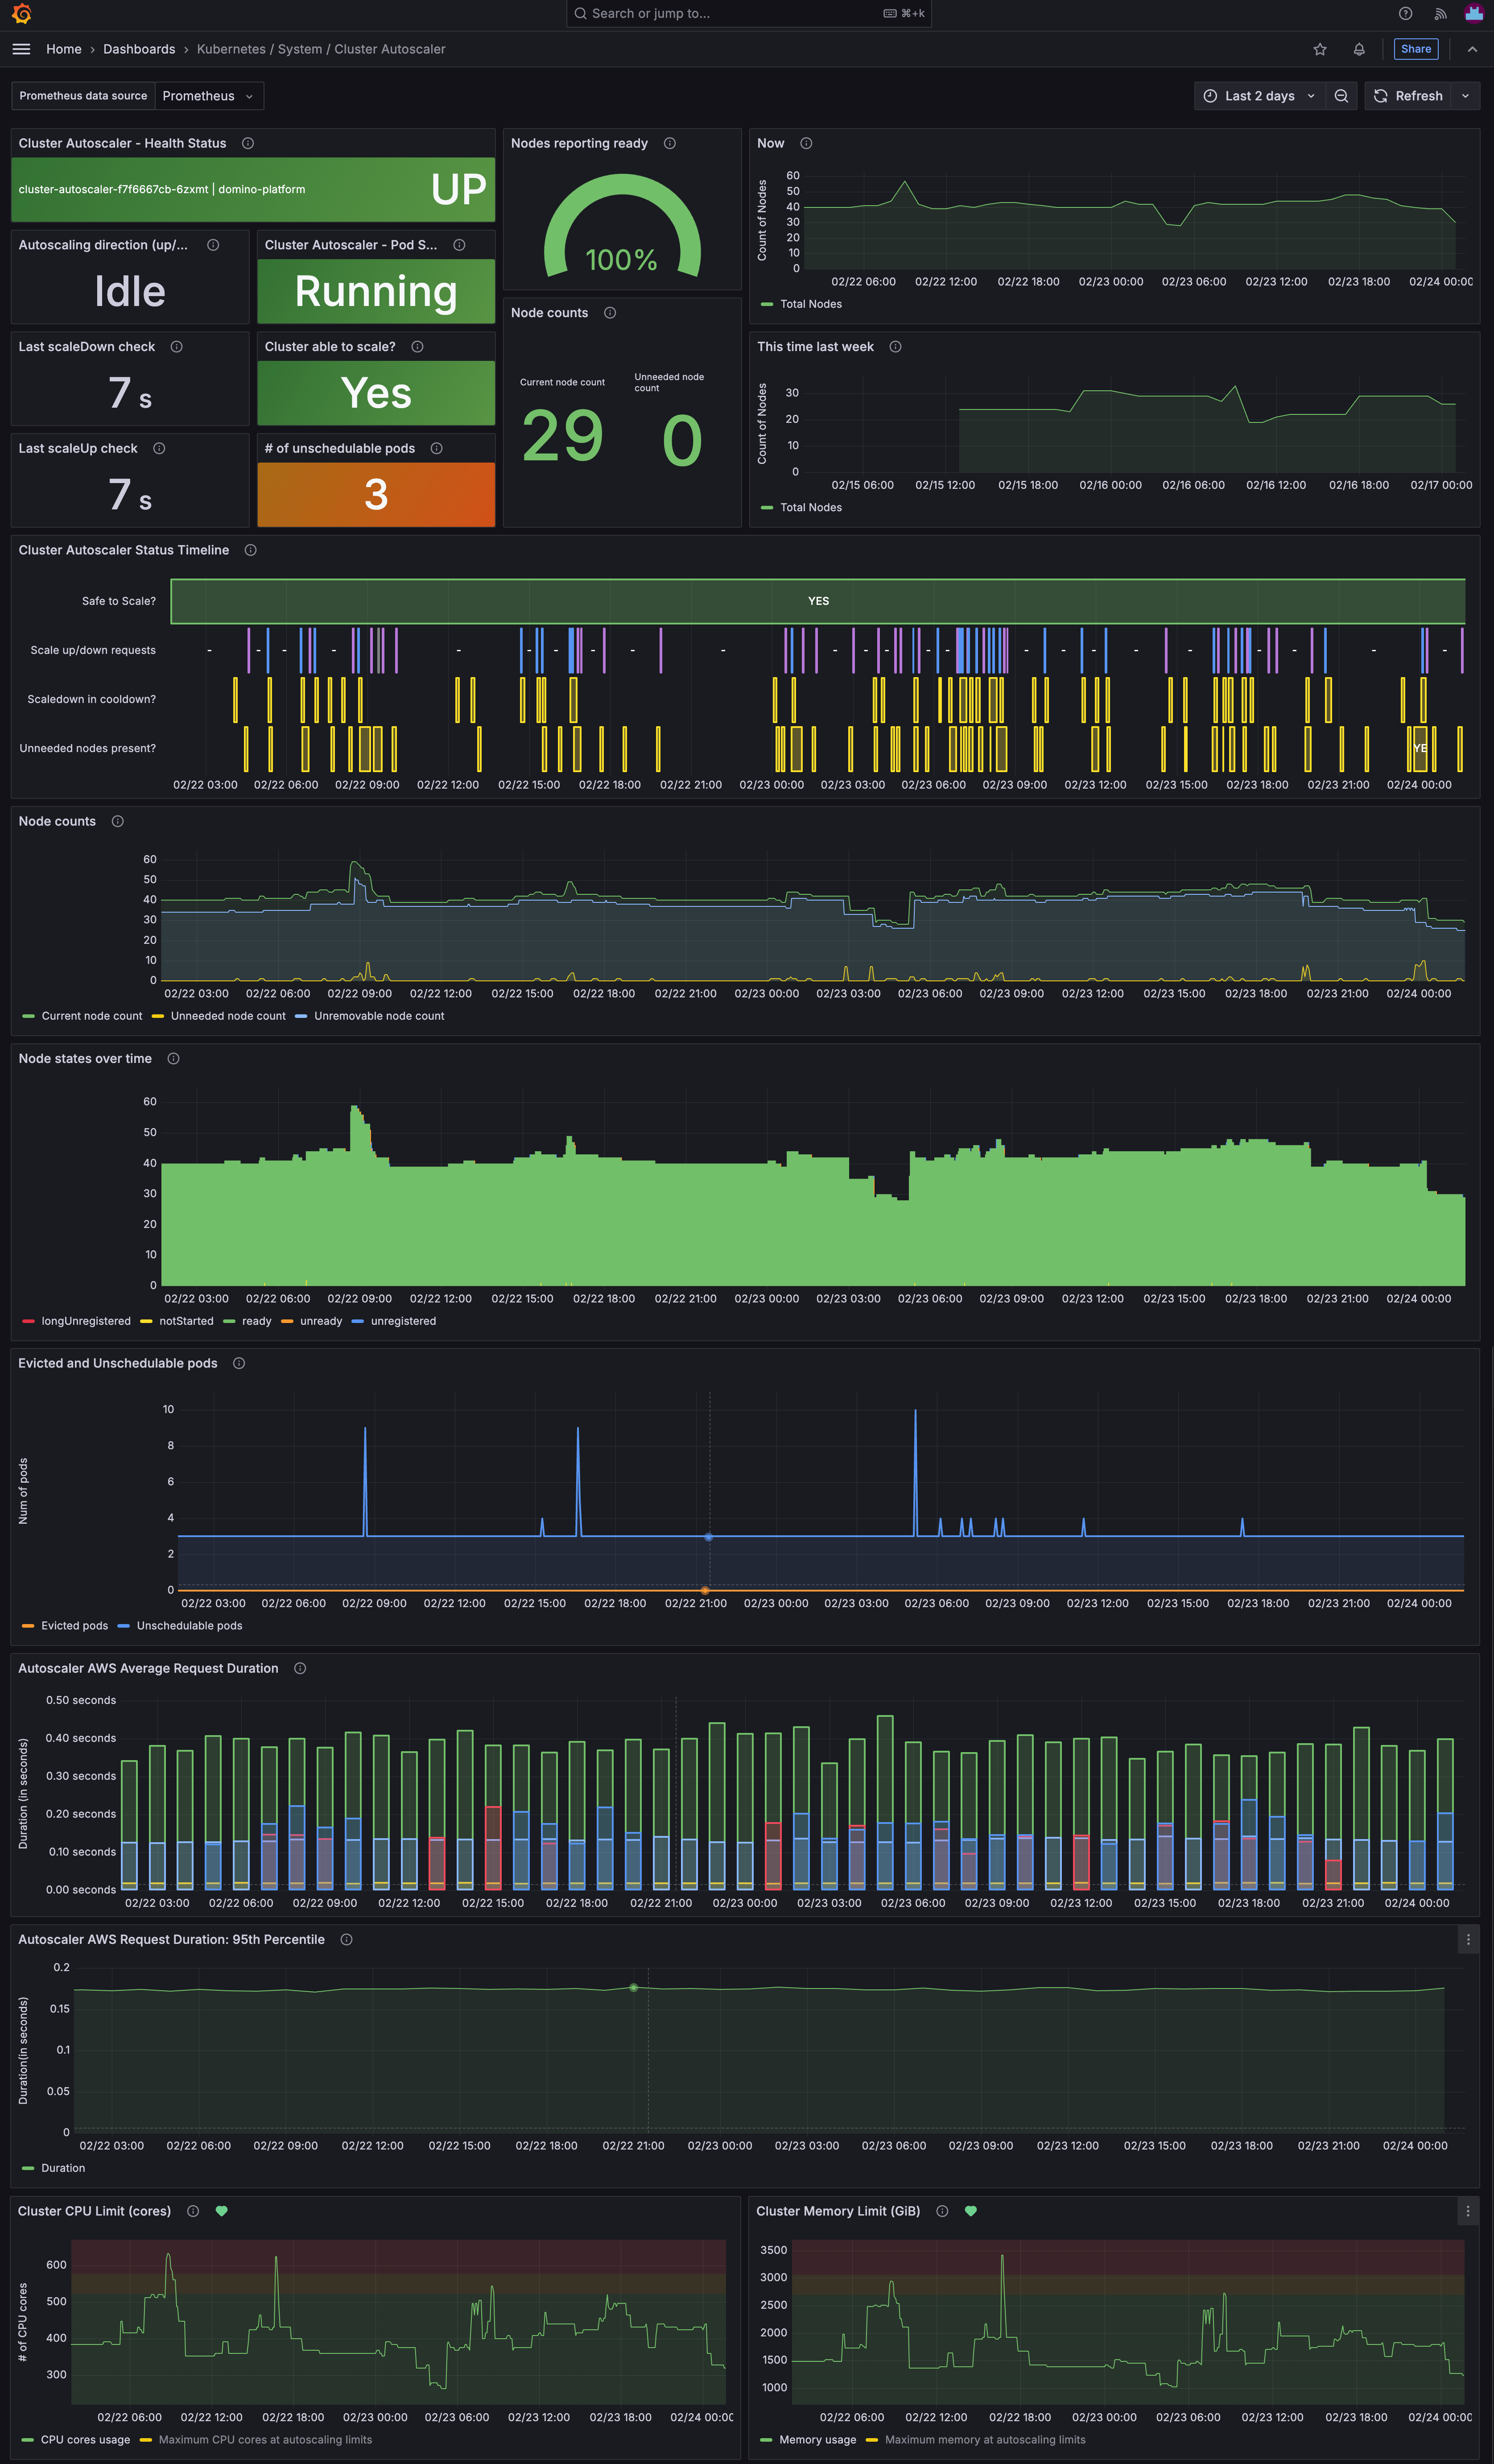
- The current health of the autoscaler.
- The number of nodes in the cluster, including a comparison to the previous week.
- A timeline of the scaling decisions made by the autoscaler.
- The number of needed, unneeded, and unremovable nodes.
- A histogram showing the number of nodes in different phases of the Kubernetes node life-cycle.
- The number of evicted and unschedulable pods.
- AWS autoscaling request durations.
- Total CPU and memory usage of the total maximum available in the cluster.
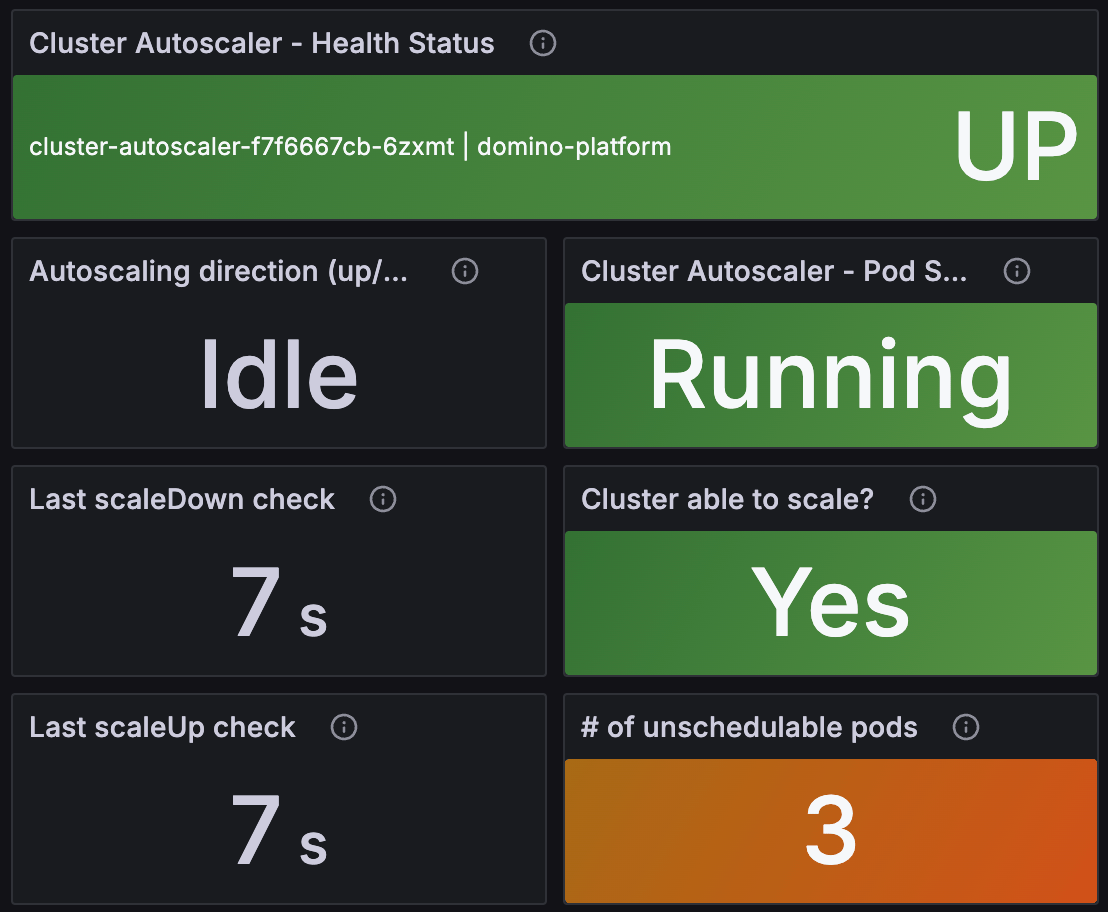
UP.
Autoscaling direction shows the direction of the last autoscaling action (Up, Down, or Idle).
Last scaleDown check and Last scaleUp check show the time of the last check for scaling down and up, respectively. If the time is too long ago, it might indicate that the autoscaler is stuck.
Cluster Autoscaler - Pod Status shows the status of the autoscaler pod.
Cluster able to scale? shows whether the cluster is able to scale up or down. The autoscaler does not scale the cluster if it detects an issue with the autoscaling groups, or if it has recently scaled up; at which point it enters a cooldown state for a short period of time.
# of unschedulable pods shows the number of pods that are currently unschedulable. If this number starts to go up then it can indicate that the cluster is unable to scale up for some reason such as lack of instances in an autoscaling group, or problems with an AWS Availability Zone.
Nodes reporting ready | Node counts | Now | This time last week
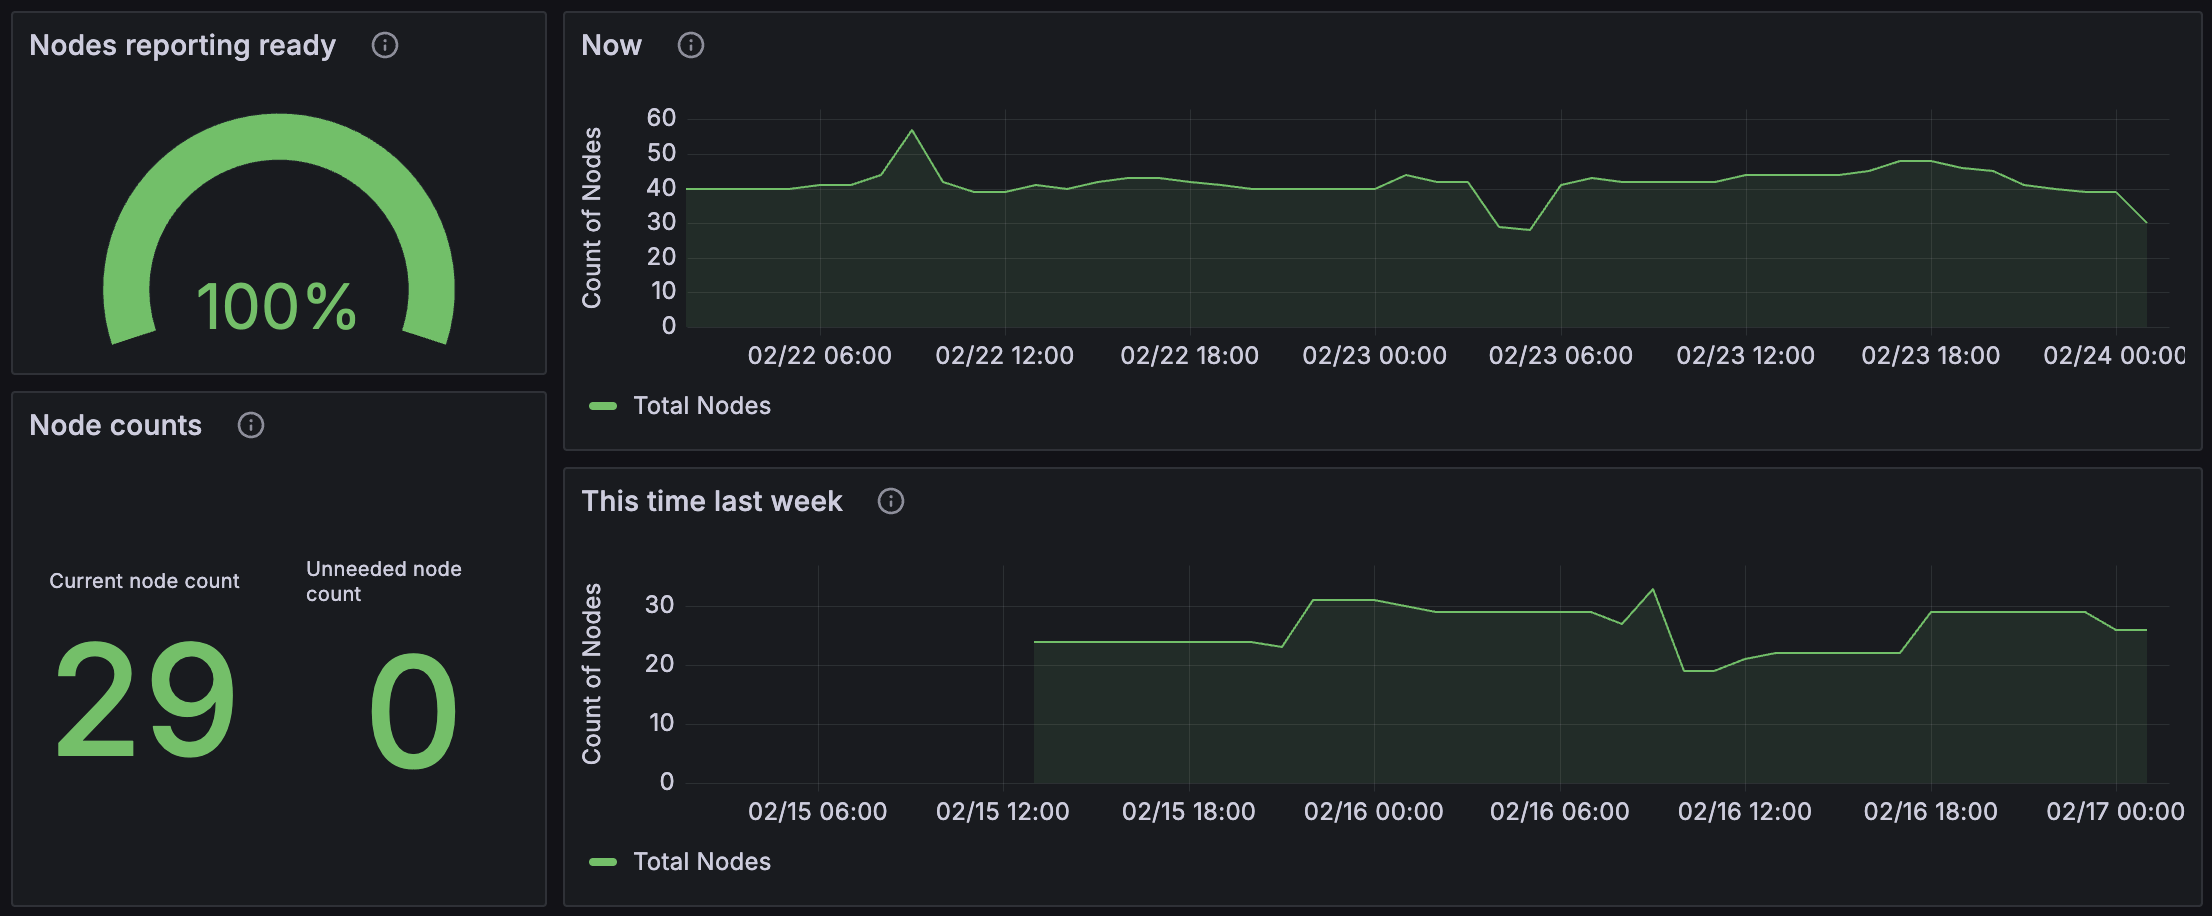
unneeded nodes. If the number of unneeded nodes is high, it might indicate that the cluster autoscaler is taking too long to scale down the cluster, or that a continuous stream of new workloads in one hardware tier is causing scale-ups, which then puts the autoscaler into a cooldown state, meaning it can’t scale down other hardware tiers.
The Now and This time last week panels show the number of nodes in the cluster over the requested period and a comparison to the same time period one week previously. This can be useful for understanding if the current cluster usage has grown or shrunk over time.
Cluster Autoscaler Status Timeline

Safe to scale? line indicates that the autoscaler considers it safe to scale the cluster at that time. Red indicates that it is not safe to scale the cluster.
Scale up/down requests shows the scale up/down requests with blue indicating a scale-up and purple a scale-down event.
The Scaledown in cooldown? line shows when the autoscaler is in a cooldown state and unable to scale down the cluster. This usually occurs after a scale-up event.
Finally, the Unneeded nodes present? line shows when the autoscaler has detected that there are unneeded nodes in the cluster that can be removed by scaling down.
Node counts

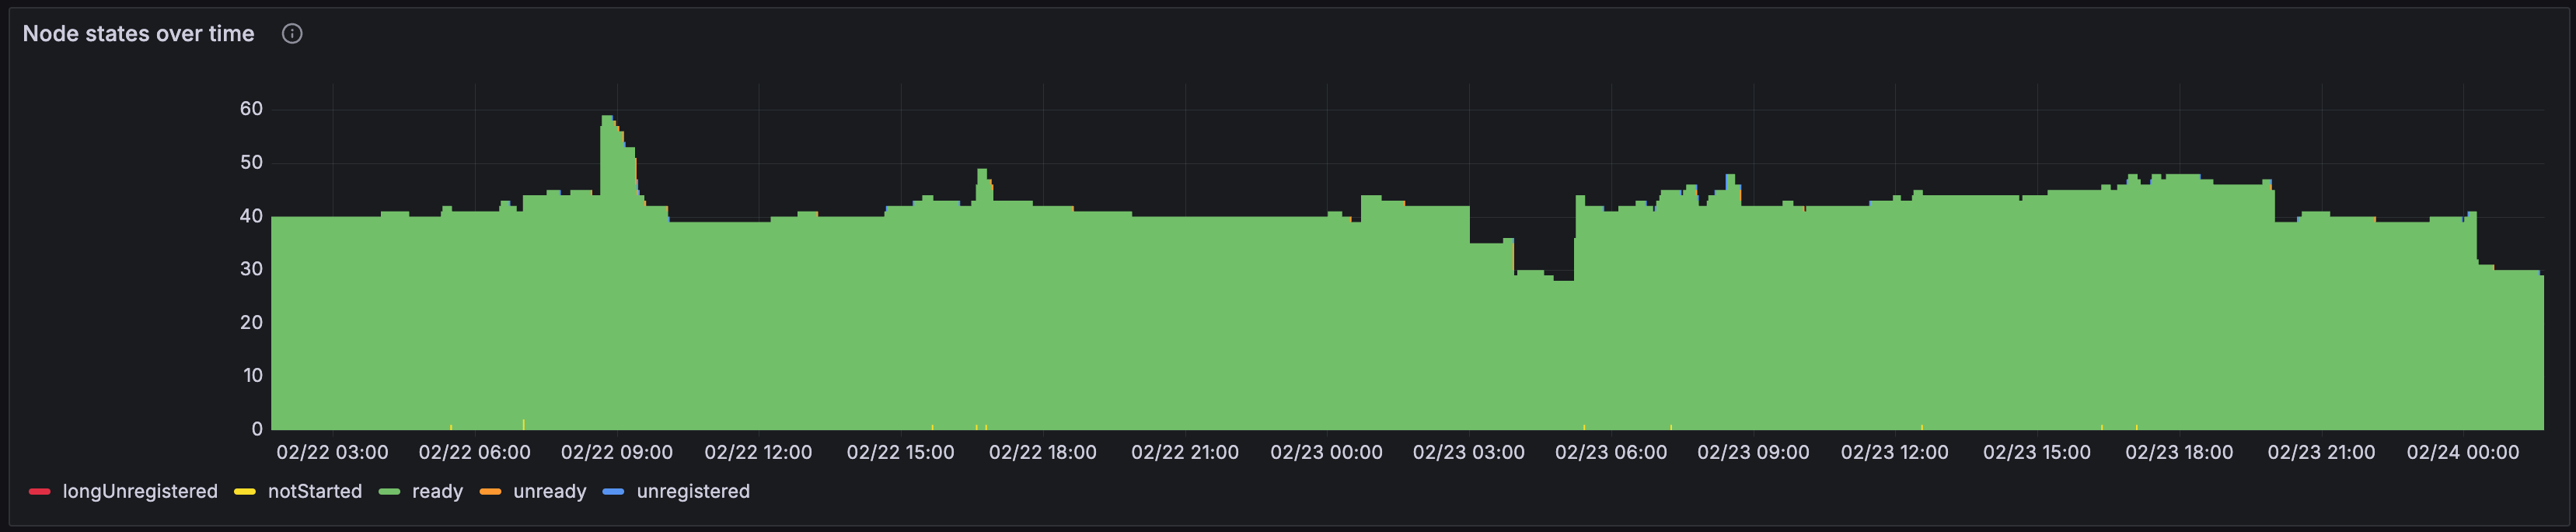
longUnregistered, notStarted, ready, unready, and unregistered. This can be useful for understanding the health of the nodes in the cluster and whether there are any issues with start-up or shutdown of nodes.
If there are many nodes in the longUnregistered state, it might indicate that there is a problem with the autoscaling group or the node itself not shutting down after it is unregistered. This can happen if it doesn’t properly release AWS resources assigned to it.
A large number of nodes in the unready state can indicate that there is a problem with the instance template used to create the node, or that the node is having trouble starting up.
Evicted and Unschedulable pods
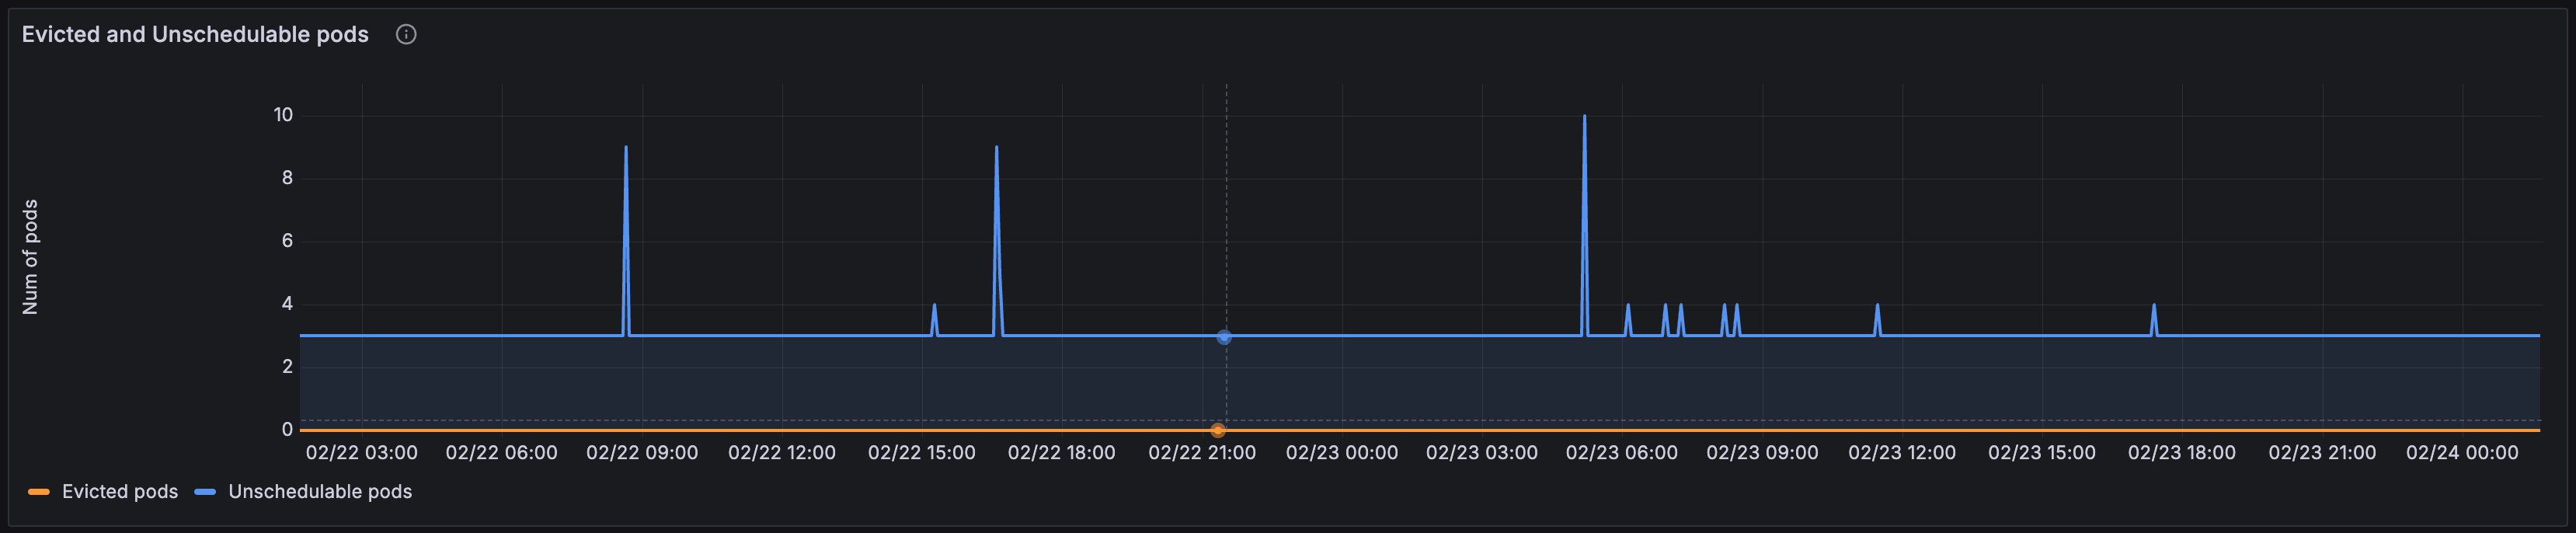
pending once the new node registers.
Autoscaler AWS Average Request Duration | Autoscaler AWS Request Duration: 95th Percentile
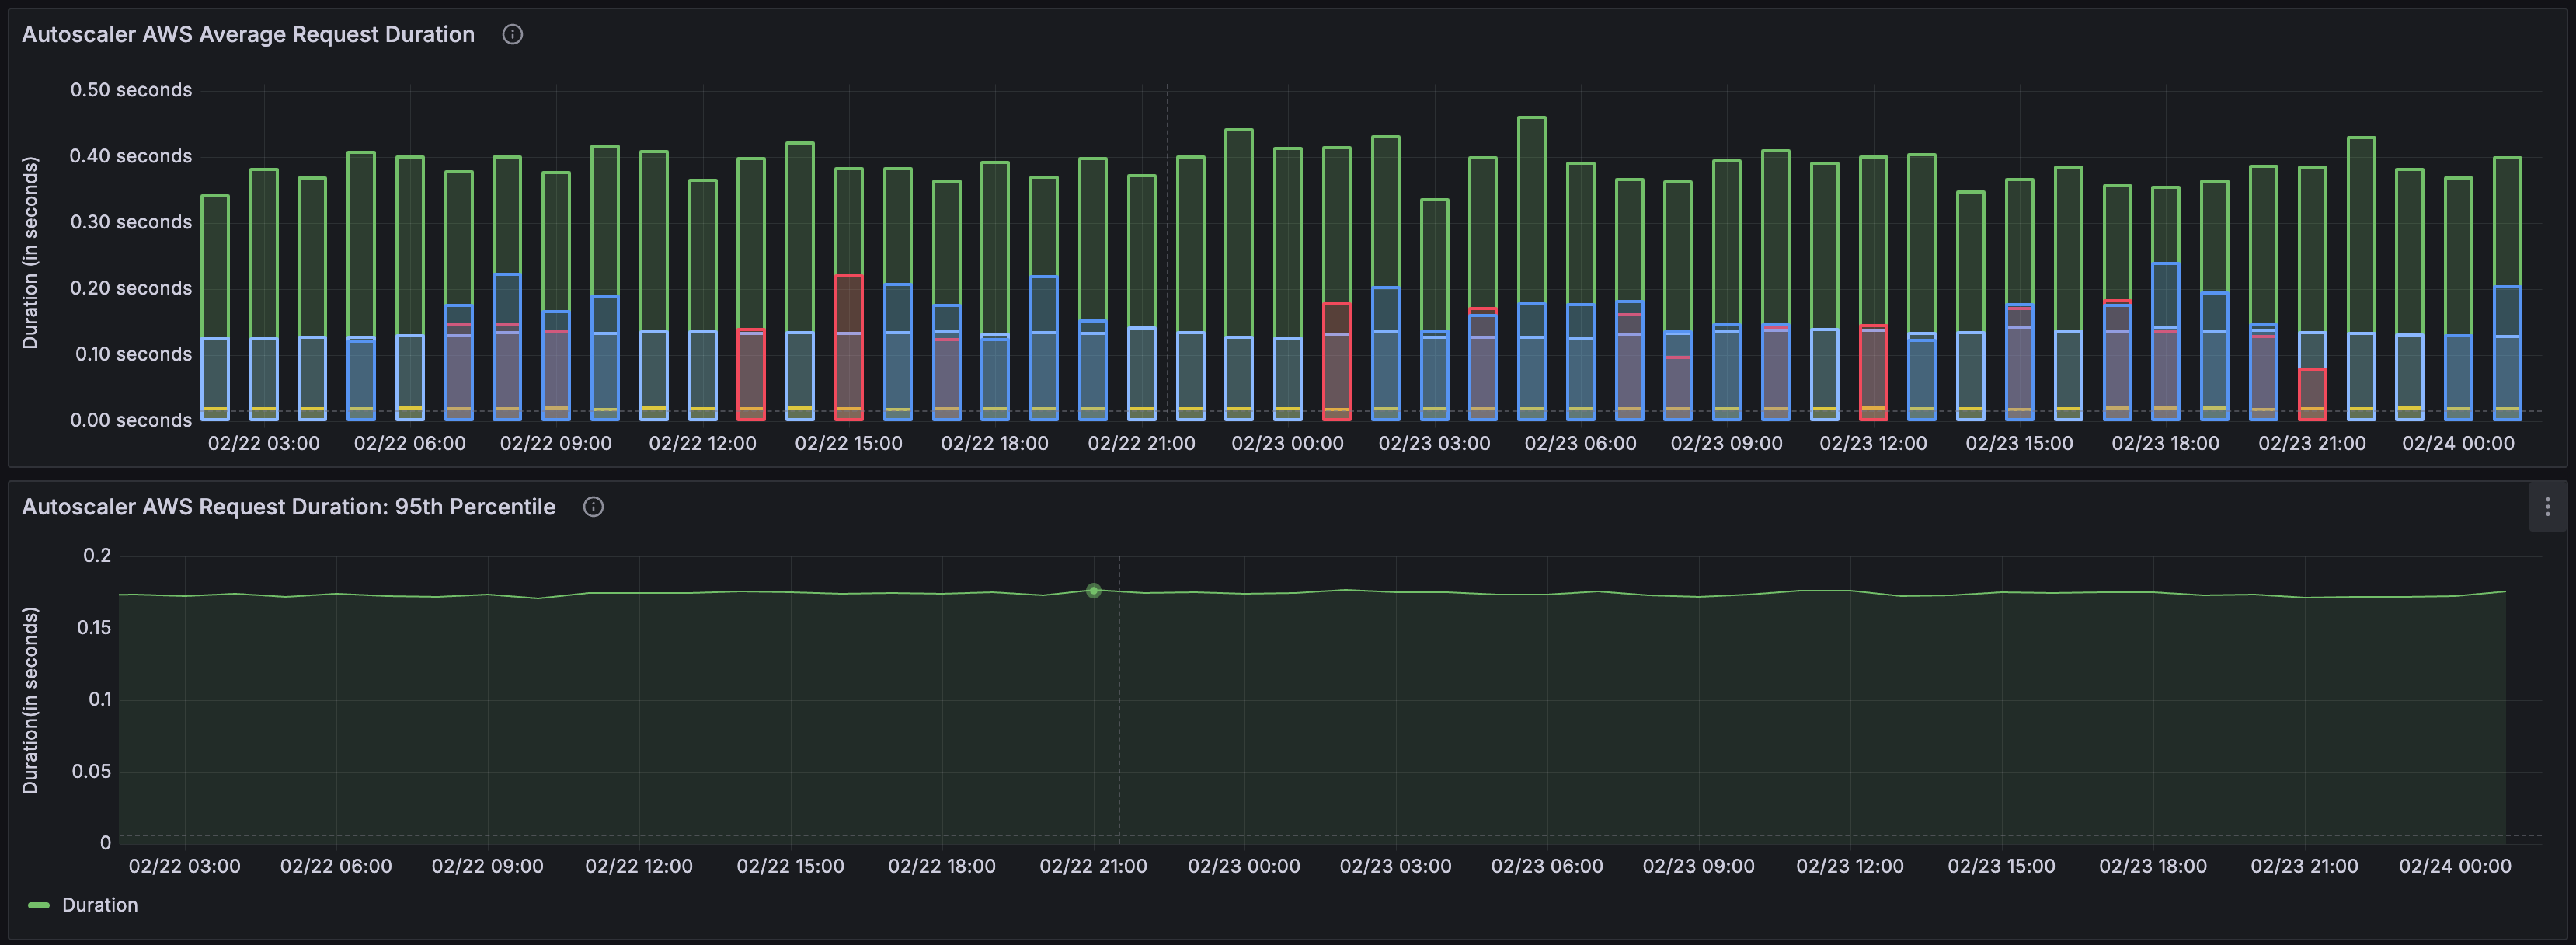

Kubernetes / Views / … and Kubernetes / System / … dashboards
TheKubernetes / Views / … and Kubernetes / System / … dashboards provide a detailed look at the state of various Kubernetes resources in the cluster. These dashboards can be useful for understanding which parts of the Domino deployment are consuming the most resources, which parts are under-provisioned, and which parts are over-provisioned. They can also be useful for understanding the health of the Kubernetes cluster itself and whether there are any issues with the underlying infrastructure.
Kubernetes / System / API Server shows the status of the Kubernetes API servers. The API servers are rarely a problem in most deployments, however, in a multi-tenant Kubernetes environment, you could have a ‘noisy neighbor’ which you would not know about if you do not have access to the monitoring for that application; monitoring the API Server could help with diagnosing this situation. The API server and related components are described fully in the official Kubernetes documentation.
Kubernetes / System / CoreDNS shows the status of the CoreDNS pods in the cluster. CoreDNS is the DNS server used by Kubernetes to resolve service names to IP addresses. If CoreDNS is having problems, it can cause issues with service discovery in the cluster. A detailed explanation of CoreDNS can be found in the official Kubernetes documentation.
Kubernetes / Views / Namespaces displays resource usage in the cluster by namespace. This allows you to easily separate resource usage of the Domino platform components from the Domino compute workloads.
Kubernetes / Views / Nodes shows the status of the nodes in the cluster, which is useful for understanding which nodes are under heavy load.
Kubernetes / Views / Pods shows the status of the pods in the cluster. This can be useful for understanding which pods are consuming the most resources or keep restarting.
Kubernetes / Views / Persistent Volumes shows the status of the persistent volumes in the cluster. There are a few services that require persistent storage and monitoring, so this is crucial to ensure that the services are running correctly.