

https://<your-domino-domain>/grafana or through the Domino Admin UI under Admin Panel > Reports > Grafana Monitoring. In-product links to Grafana from the Domino UI point to this endpoint.
Starting in 6.3.0, the Grafana Operator manages this instance. Dashboards, alerts, contact points, and notification policies are Kubernetes custom resources, so you can add your own or override the ones Domino ships. See Manage Grafana dashboards and alerts as custom resources.
Access the legacy Grafana instance during migration
If you customized dashboards or alerts through the Grafana UI on the pre-6.3.0 instance, that work lives on the legacy Grafana persistent volume, not in the operator-managed instance. During the migration window you can reach the legacy instance athttps://<your-domino-domain>/grafana-classic.
To migrate dashboards, alerts, and data sources from /grafana-classic to /grafana, follow Migrate Grafana dashboards and alerts to the operator-managed instance in Domino 6.3 on the Support site (requires sign-in).
Out of the box, Grafana should be configured with SSO so that users with a SysAdmin role are automatically logged in to the Grafana UI if they are logged in to Domino. If they are not currently logged in to Domino or their session has expired, they see the Grafana login screen.
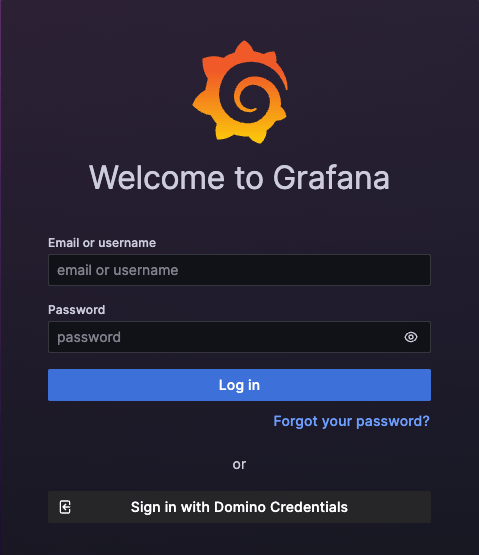
Login when SSO is unavailable
In situations where SSO is not working (for example, Keycloak is unavailable for some reason), there is a backup method to access Grafana with Admin privileges, as detailed below.-
Get the Grafana password:
The Grafana Admin password is stored in a secret called
grafanain thedomino-platformnamespace. Retrieve the password withkubectl:In some cases, namespaces may vary across deployments. -
Navigate to the Grafana login page:
-
Enter the Email or username as
grafana. - Enter the password you retrieved above.
- Click Log in.
-
Enter the Email or username as