

Overview
The Admin Toolkit is an always-on tool deployed alongside Domino in the Kubernetes cluster that allows Domino administrators to run a system scan on the Domino deployment to do the following:- Check for unpatched known issues
- Validate the health of core services
- Get information to assist troubleshooting, run remediation actions, or provide context about issues affecting the deployment
- Provide the toolkit report to Domino Support as part of an incident
How it works
The toolkit has a front-end web interface provided athttps://<your-domino-url>/toolkit/ where you can view scan reports, initiate new scans, and export platform logs.
You can run scans as many times as necessary because the checks performed by the toolkit are only reading information and not making any modifications.
You can run a scan during any of these stages:
- After a new Domino install
- At the start of an incident
- In the midst of an incident
- After incident resolution to verify health
- Before and after a Domino upgrade
- Before and after a Domino migration
Use the Admin Toolkit
The Admin Toolkit is available:- at the URL:
https://<your-domino-url>/toolkit/ - through the Domino Admin UI under Admin Panel > Reports > Diagnostic toolkit.
Continue with Domino SSO takes the user to the normal Domino login screen where they can log in using their Domino credentials as normal. Once logged in, Domino redirects back to the Toolkit UI.
All Domino SysAdmin users are automatically granted the Toolkit Admin role.
Log in when SSO is unavailable
This is a break-glass procedure. If the toolkit pod itself is unavailable, resolve the pod issue before attempting this login. When SSO is not working (for example, Keycloak is unavailable for some reason), then there is a backup method to access Toolkit with Admin privileges.Get the Admin Toolkit password
The Admin Toolkit password is stored in a secret calleddomino-admin-toolkit-http in the platform namespace.
Retrieve it with kubectl:
-
Enter
admin-toolkitas the username. - Enter the password you retrieved in the preceding step.
- Click Login.
Run a system scan
-
Navigate to
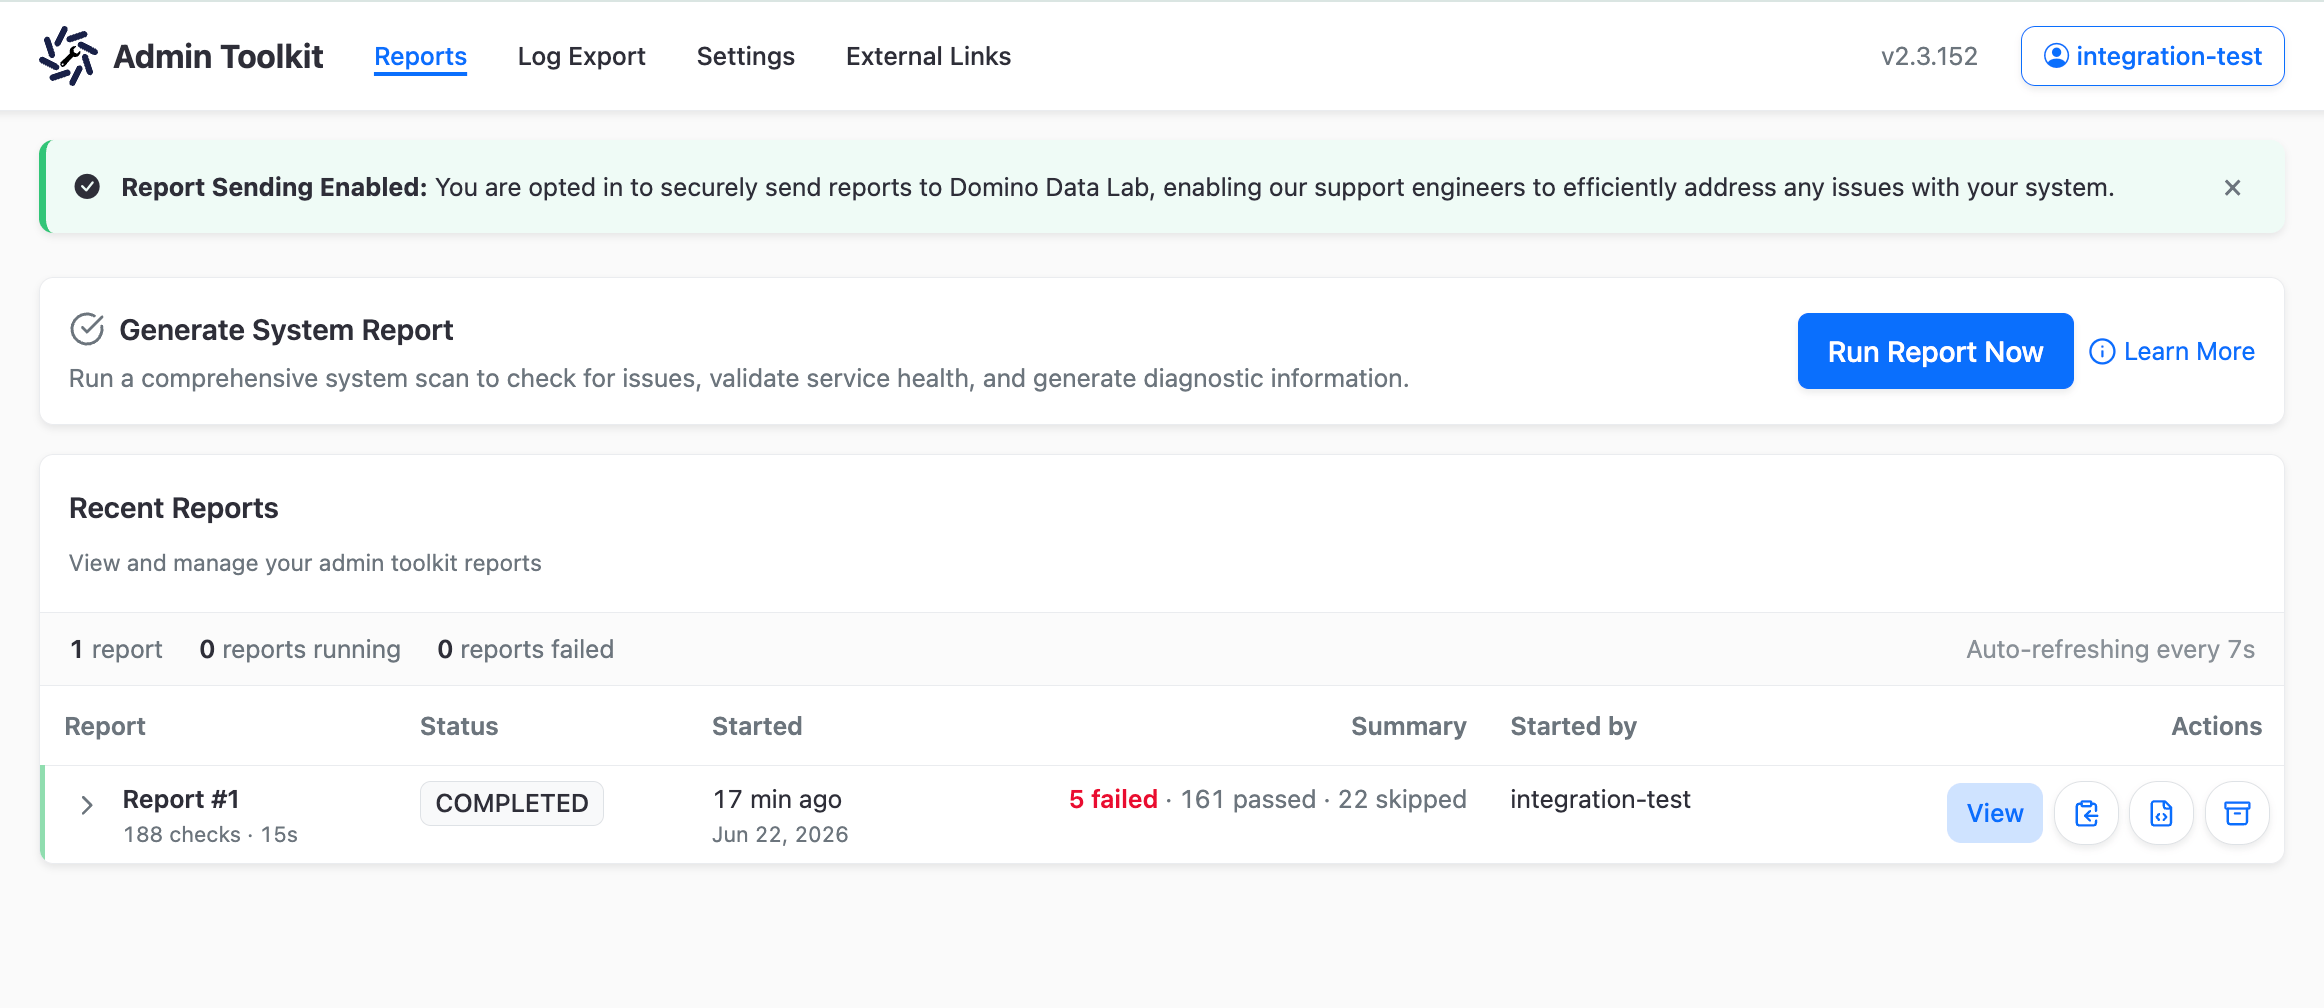
https://<your-domino-url>/toolkit/and log in. - Click the Run Report Now button at the top of the Reports page.
View the reports
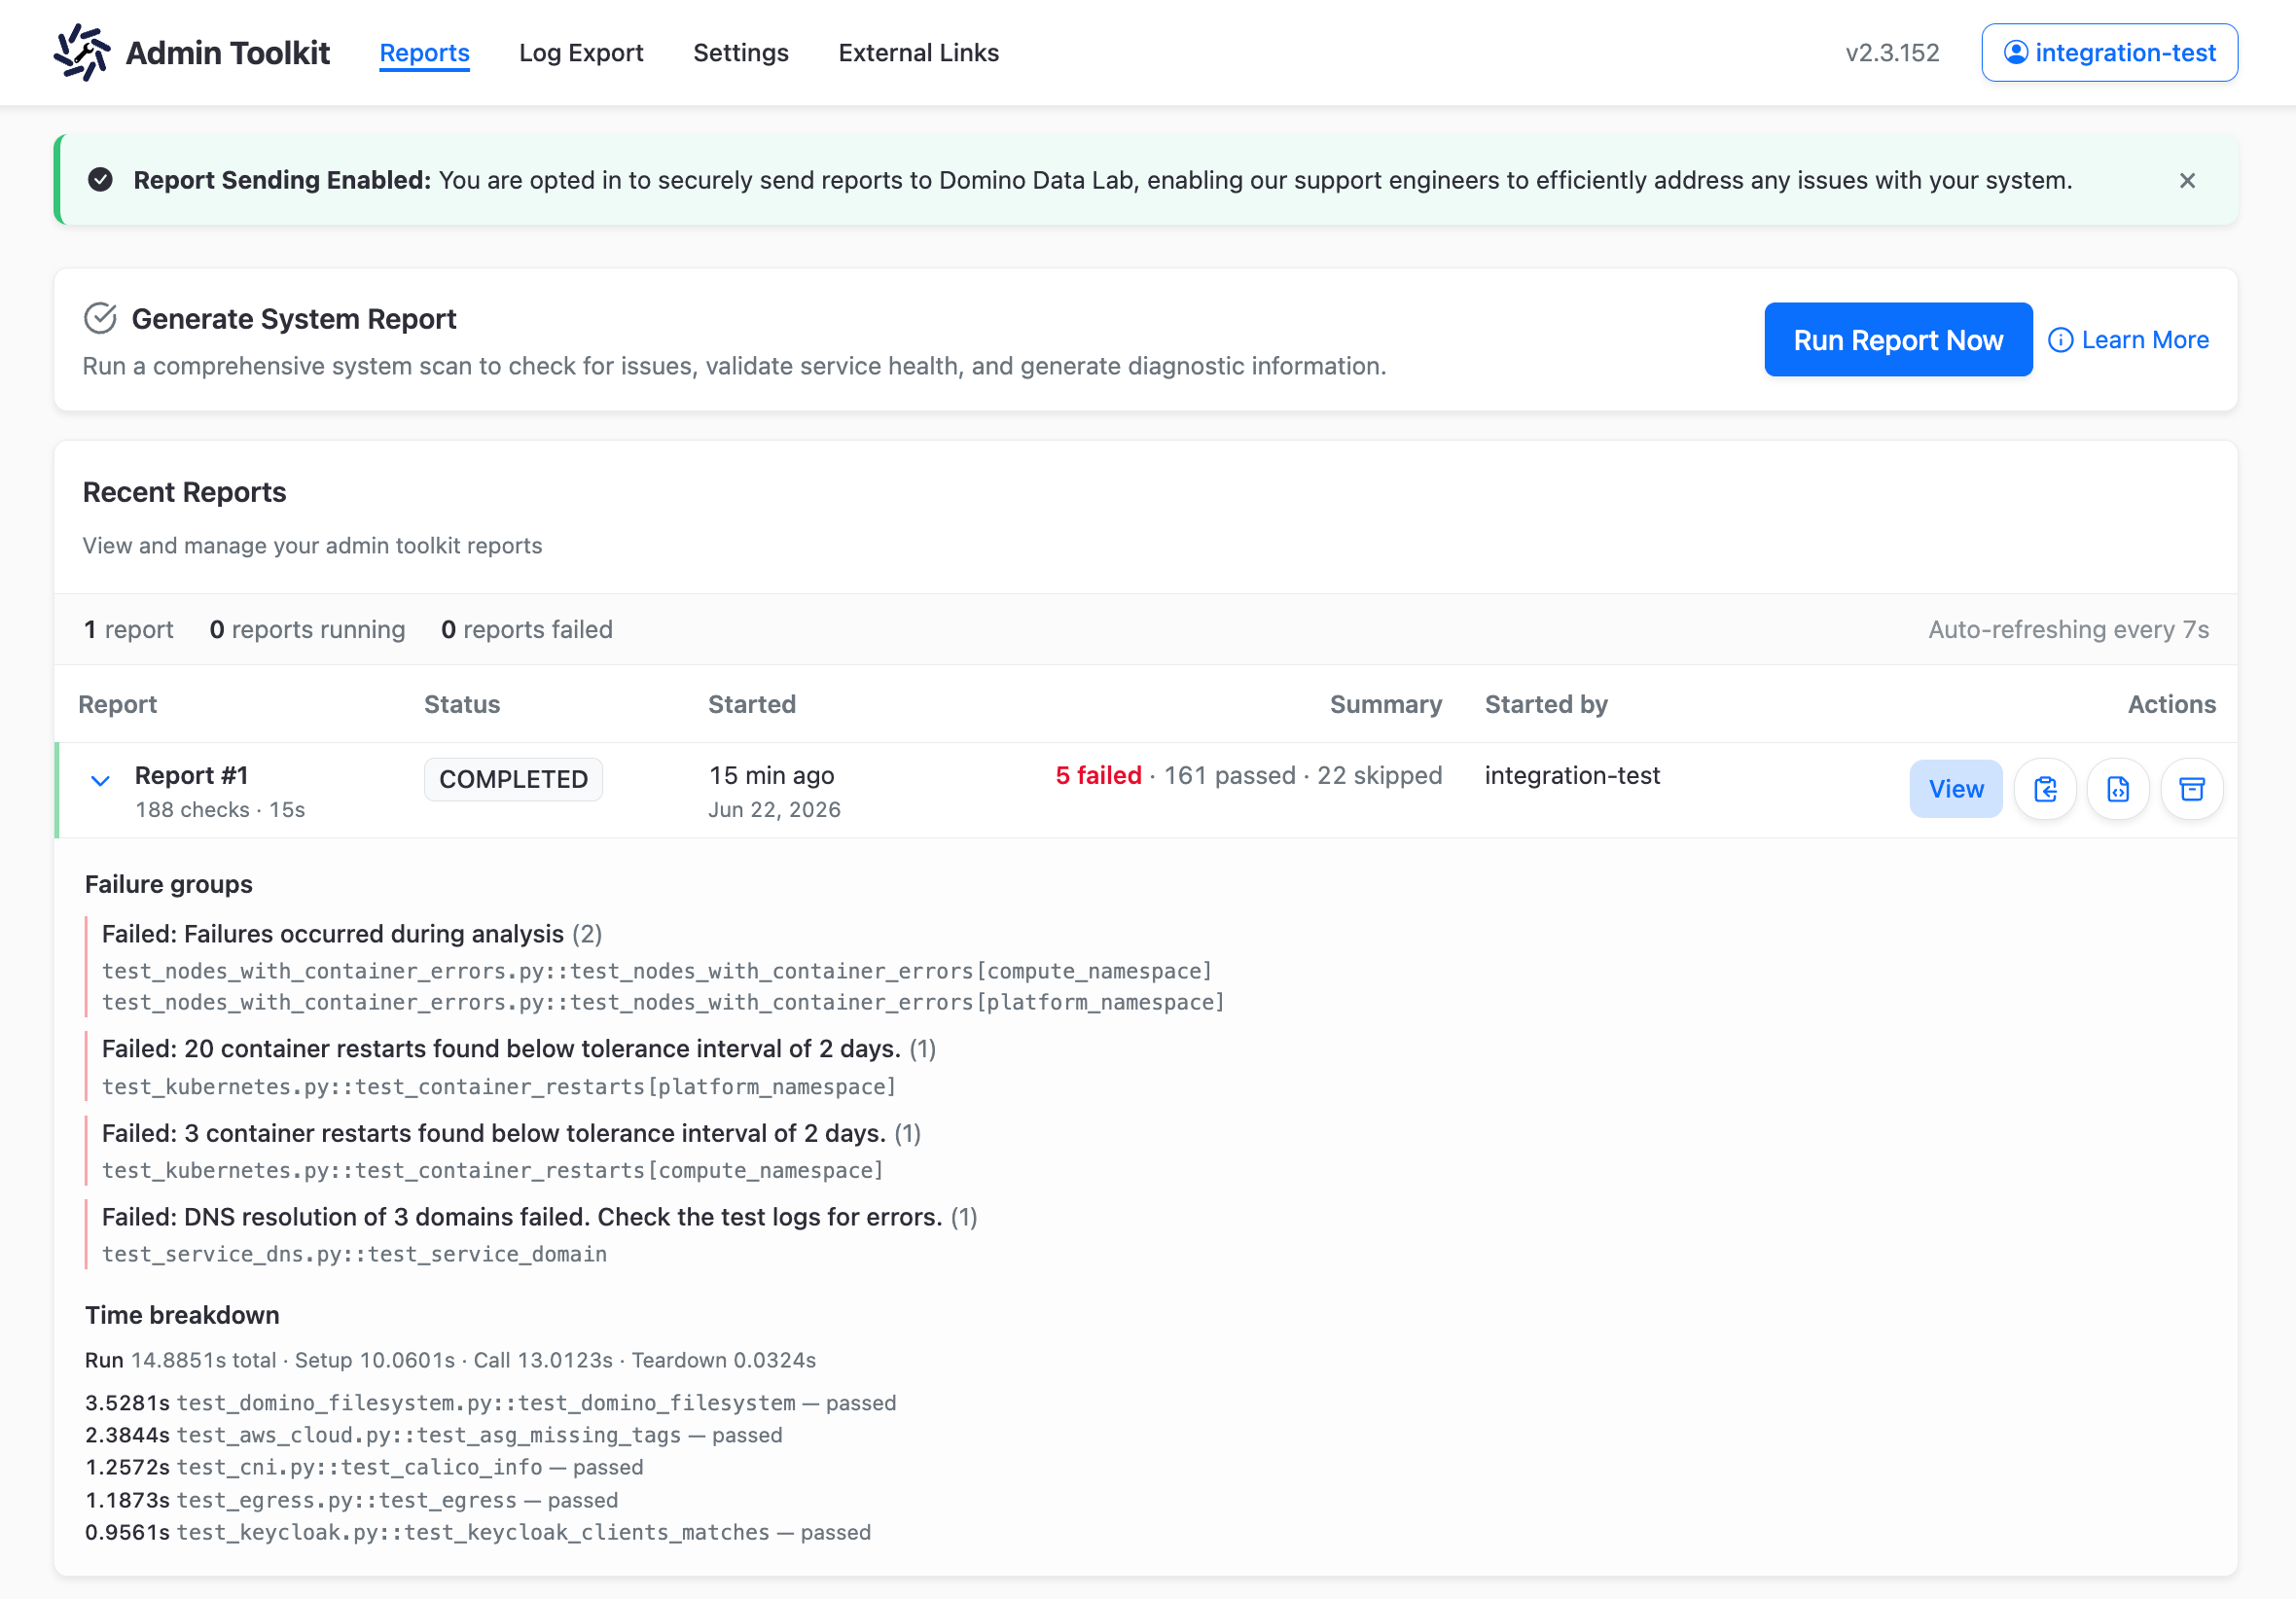
Use the Admin Toolkit’s Reports tab to review completed scans. The Recent Reports section displays a list of the 10 most recent reports with the following information:-
Status:
COMPLETED,RUNNING,PENDING, orFAIL - Summary: counts of failed, passed, and skipped checks
- Started: timestamp and date of the scan
- Started by: the user who initiated the scan
- Failure groups: checks that failed, grouped by error type, with specific test names listed
- Time breakdown: total run time and duration of the slowest individual checks
Download or delete a report
Each report in the list has action buttons:- View: open the full HTML report in the browser
- Download HTML: save the report as a standalone HTML file
- Download ZIP: download an archive containing the HTML report and a machine-readable JSON results file
- Delete: remove the report
Reports are stored in the toolkit database and persist across container restarts within the same pod. If the toolkit pod is rescheduled or deleted, stored reports are lost. With kubectl access you can bulk-copy all stored reports:
Read a report
Each check in a toolkit report produces one of the following results:
For every check the report shows a description of what was checked, the result, the evidence collected (tables, counts, thresholds), and troubleshooting and resolution steps where applicable.
Filter checks in the report
Each scan runs the full toolkit check suite: general health checks, informational checks, pre-upgrade checks, and pre-migration checks. You cannot limit a scan to a single category from the web UI or API. After a scan completes, open the HTML report and use the Show Checks toggle to filter what is displayed:
For upgrade or migration workflows, run a normal scan and filter the report to the relevant category. Resolve any failures before proceeding.
For deeper guidance on a specific check, see the Support site knowledge base or the embedded docs at
https://<your-domino-url>/toolkit/docs/.
What the toolkit checks
At a high level the checks cover the following areas:-
Core services: MongoDB, Postgres, Redis, RabbitMQ, Vault, Elasticsearch, Keycloak, Nexus,
nucleus-frontendhealth endpoint. - Kubernetes and the cluster: node health, control-plane / Kubelet version drift, etcd, OOM kills, time drift, flapping nodes, ephemeral storage, kernel vulnerabilities (all platforms), CNI, Istio, CoreDNS, NGINX ingress, cluster-autoscaler, Karpenter capacity.
- Domino platform: deployment compatibility matrix, HelmRelease drift, central config, image builder, image cache, container image versions, mutating-webhook patches, Flows pods, workload-service log analysis.
- Sizing and capacity: platform sizing, hardware-tier sizing, replica counts, file-task queue status, run queue.
- Networking: service DNS, egress, network stats, Docker Hub rate limits.
-
Certificates: TLS secret expiration, Domino URL certificate,
cert-managerhealth. - Storage: platform PVCs, Domino filesystem, dataset lifecycle, backup cronjobs.
- Observability: Prometheus, Grafana, Grafana alerting, Dynatrace, New Relic.
- Cloud-specific: AWS cloud config, AWS-specific kernel vulnerability checks, ulimit configuration.
- Model Monitoring (DMM): ingestion job status, Redis queues, pod list.
Export platform logs
The Log Export tab provides a web interface for collecting and bundling logs from Domino platform components. Use it to gather diagnostic logs for troubleshooting or to share with Domino Support.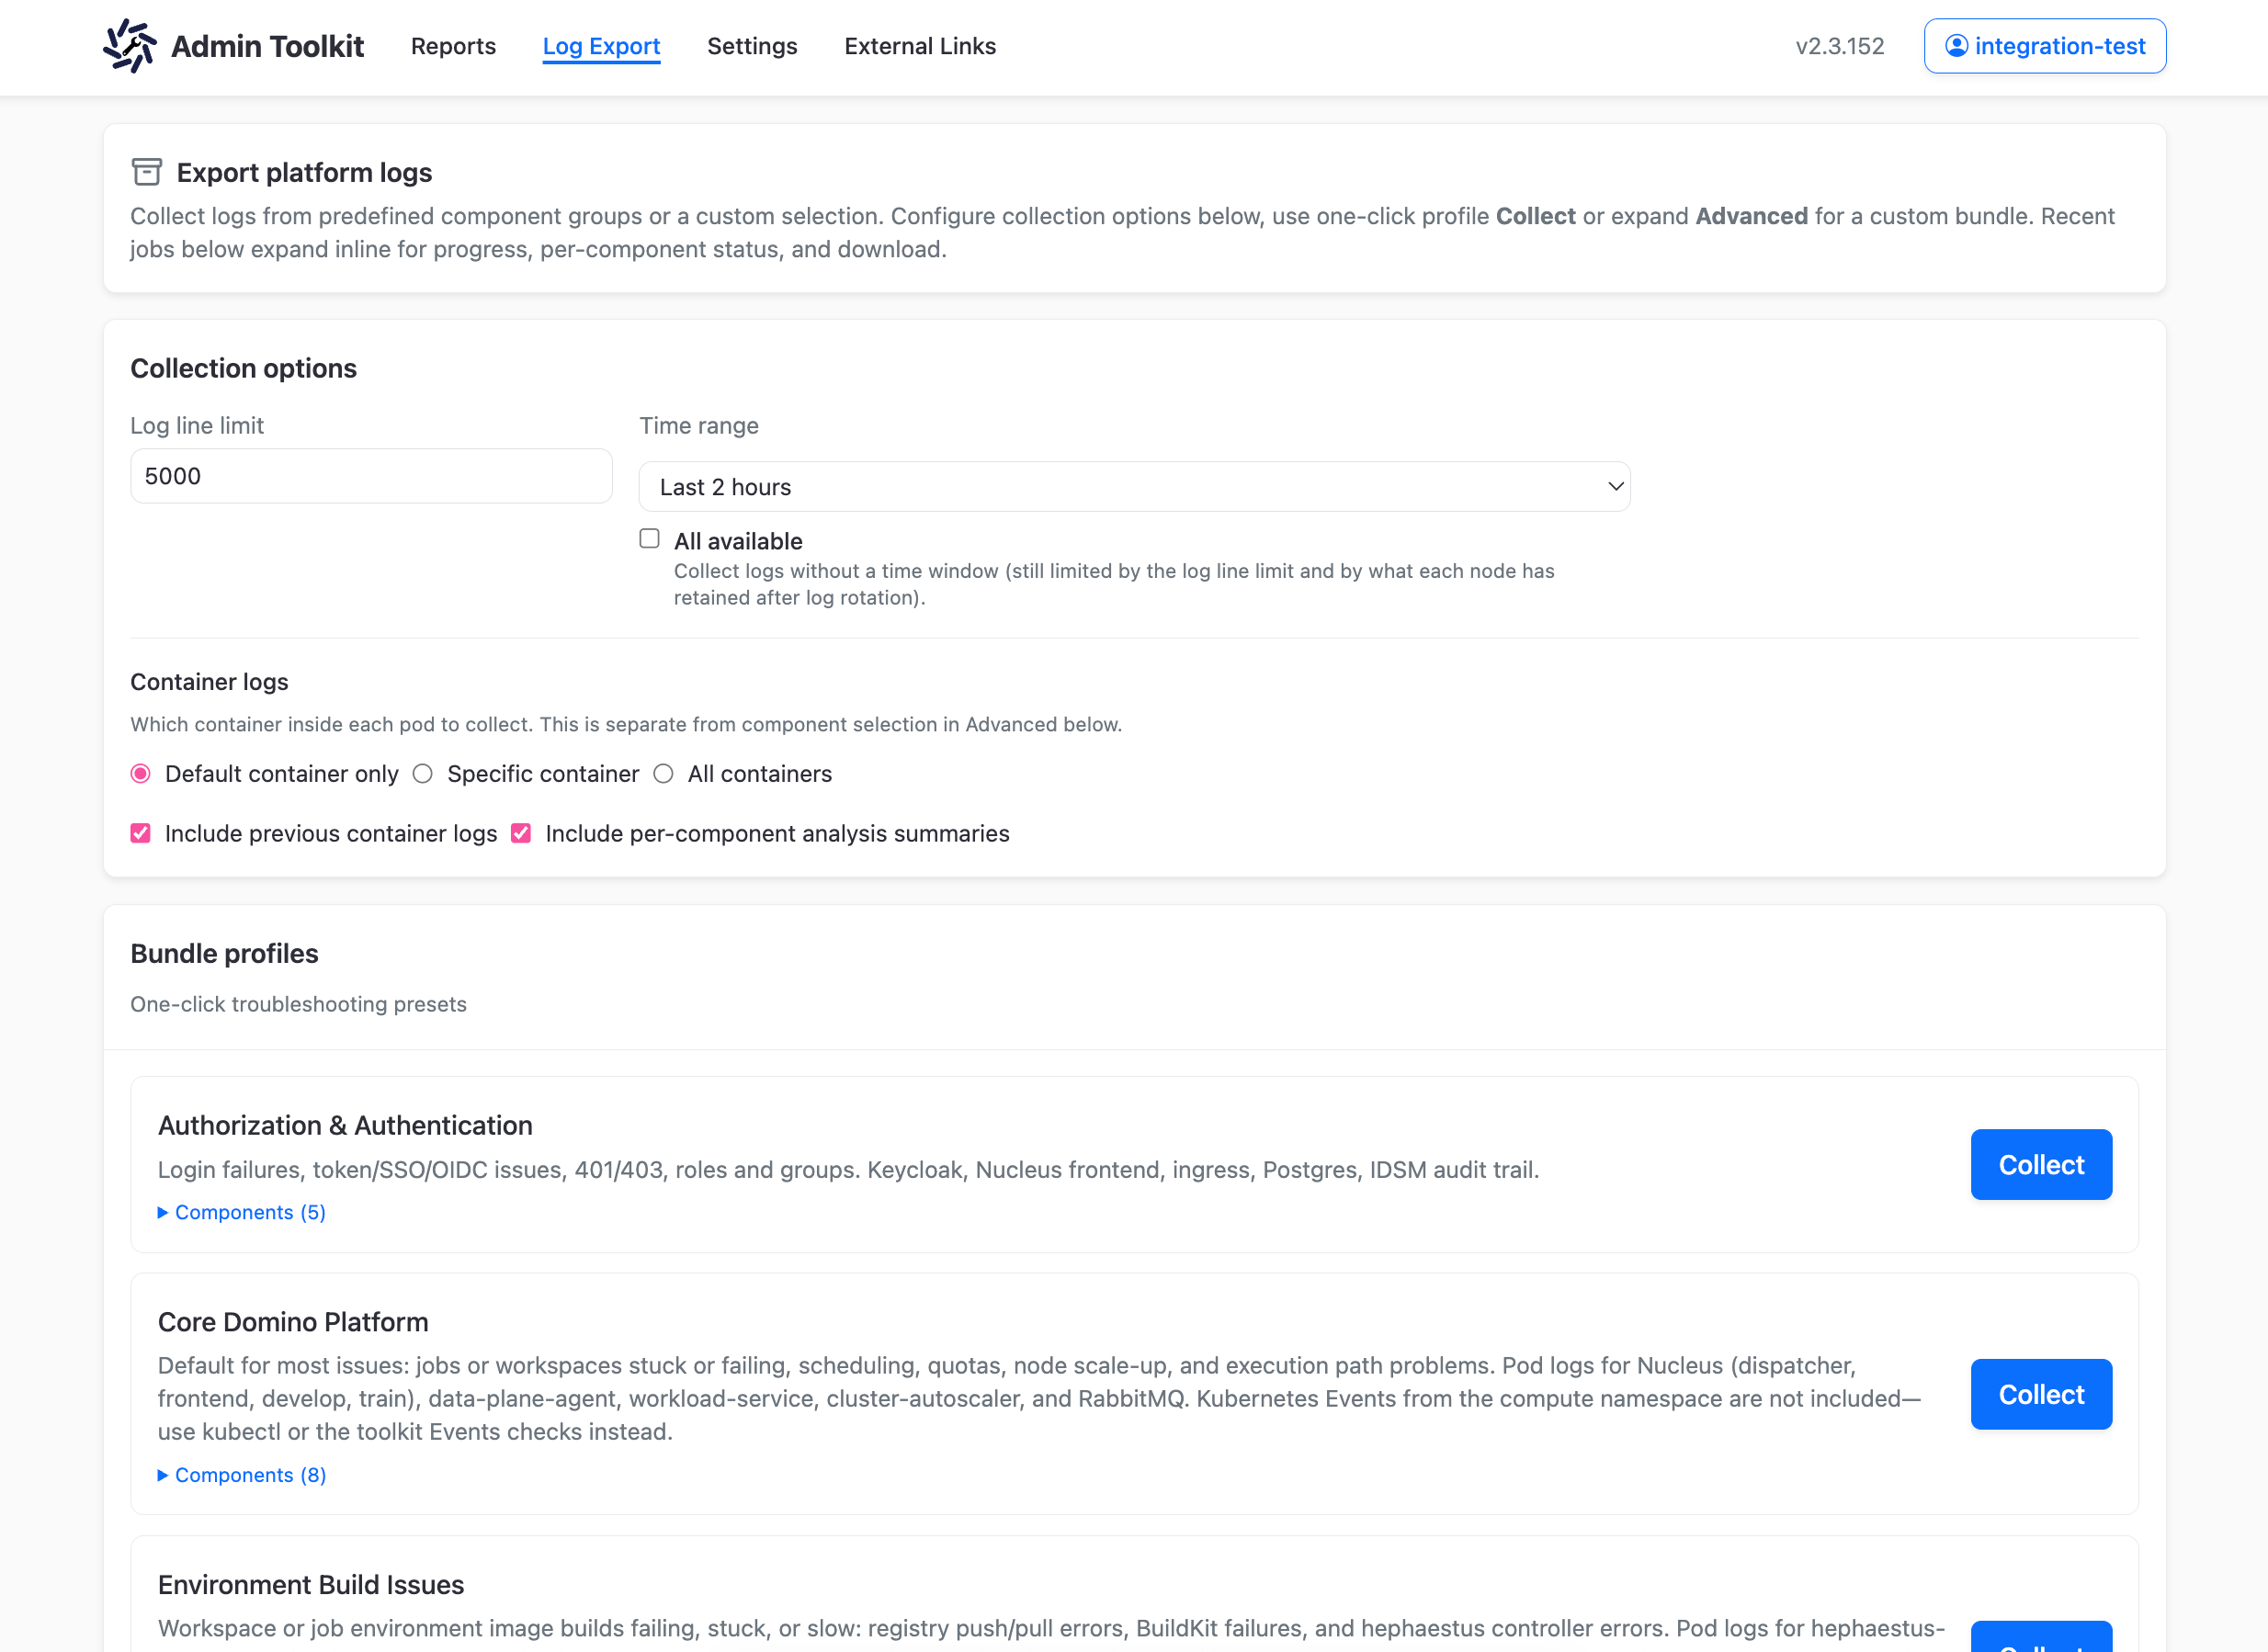
Collection options
Before starting a collection, configure the options at the top of the Log Export page:Bundle profiles
Bundle profiles are one-click presets for the most common troubleshooting scenarios. Each profile collects logs from a predefined set of components. Click Collect next to the profile that matches your issue:
Click the ▸ Components (N) link under each profile to see the full list of components included.
Workspace and user log collection
The table below maps common workspace troubleshooting scenarios to the appropriate collection method:Advanced custom component selection
Expand the Advanced section to manually select individual components for collection. Use this when no bundle profile matches your scenario or when you need logs from a specific component only.Recent log bundles
The Recent log bundles section shows the history of past export jobs and auto-refreshes while jobs are running. Expand a row to see live per-component progress and to download the completed bundle as a ZIP archive.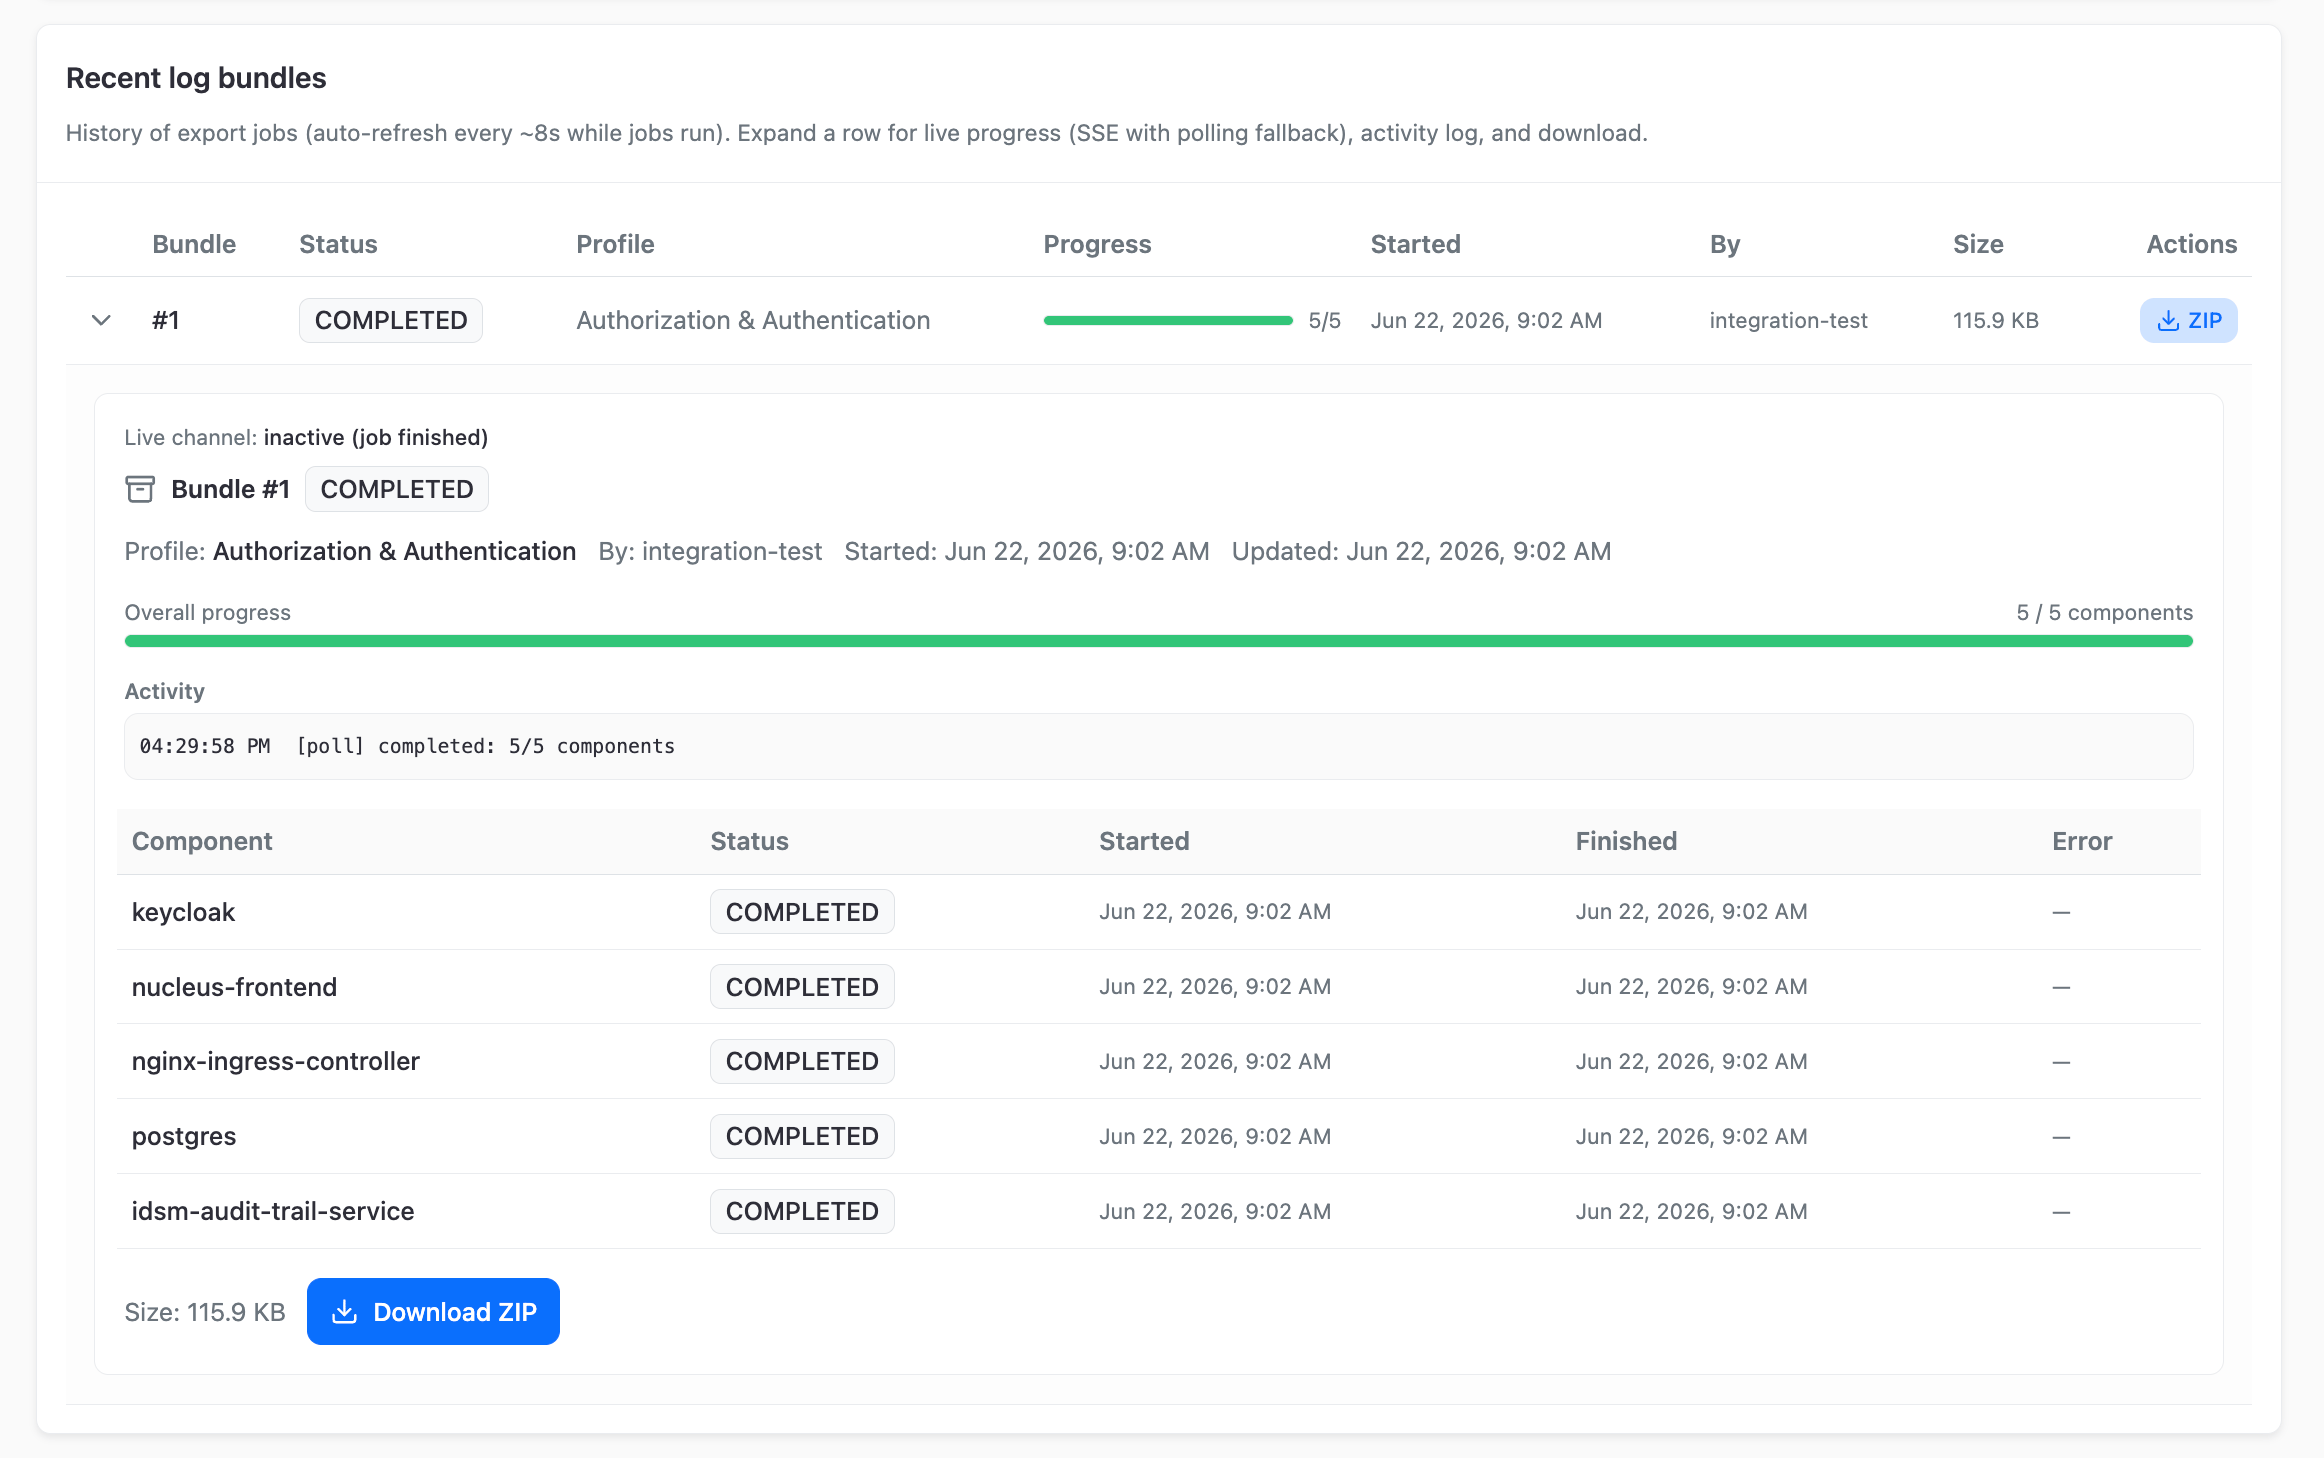
Send reports to Domino
Regardless of whether a scan runs from the web interface or API, the toolkit can automatically upload the report to a centralized S3 bucket owned by Domino within Domino’s internal AWS account. Access is restricted to authorized Domino engineers via single sign-on (SSO). This behavior is on by default, but you can turn it off by selecting the opt-out option in the web interface or by applying aConfigMap.
There are many benefits to uploading reports to Domino:
- Quicker resolution of support tickets.
- Validation of deployment configuration.
- Receive more proactive, rather than reactive, support.
Turn report sending to Domino on or off
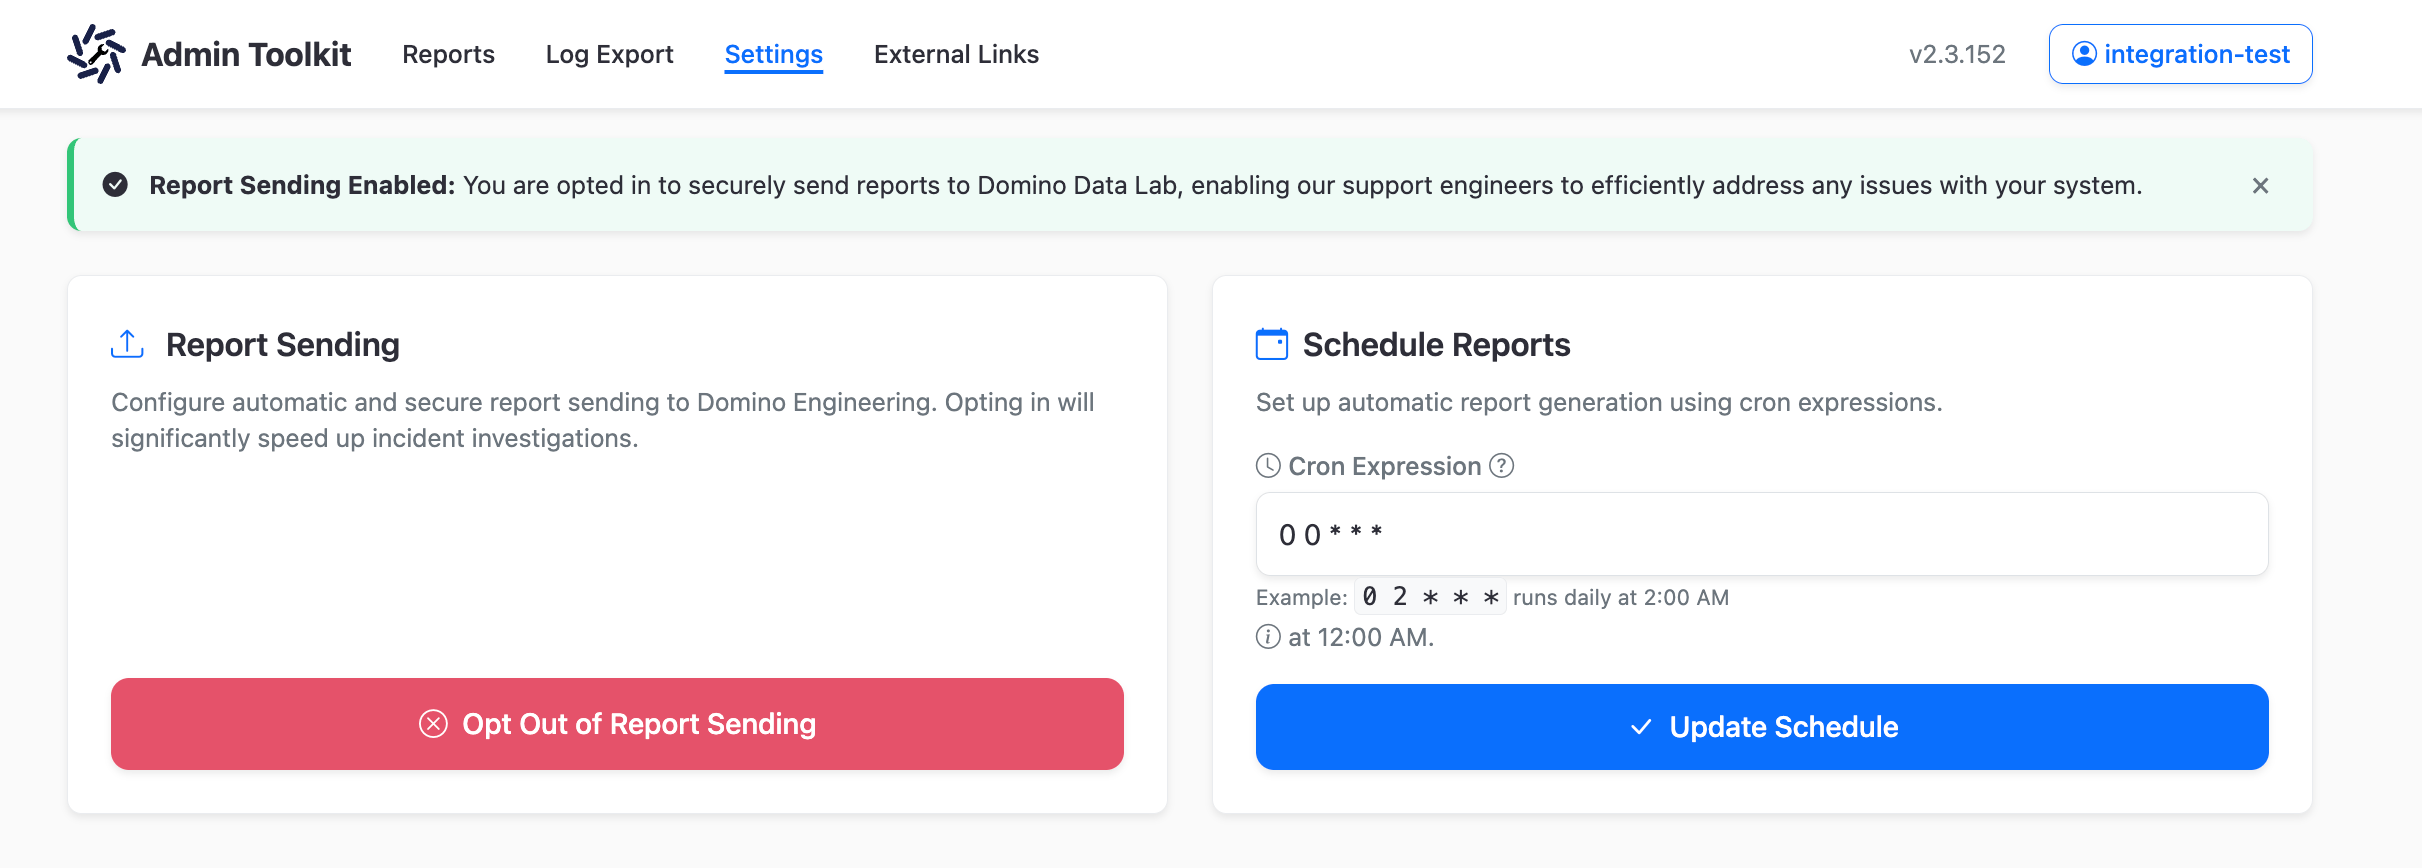
By default, the feature to have reports uploaded to Domino is on. Each newly generated toolkit report is securely sent to Domino Support and Engineering. This allows Domino engineers to gain access to the reports faster during an outage and get historical context to previous outages. You can opt out of this service (or opt in again) via the web interface. To opt out, navigate to the Settings tab, find the Report Sending card, and click the Opt Out of Report Sending button. To opt back in, click the Opt Into Report Sending button.Reports do not contain passwords or secrets. They may include hostnames, IP addresses, usernames, and partial log data.
Scheduled reports
Scheduled reporting lets you generate Domino health reports at regular intervals. Having a “healthy state” report handy provides a comparative baseline during system disruptions. This can be invaluable in swiftly identifying system anomalies, thus accelerating the issue resolution process.Set up scheduled reporting
Follow the steps below to set up scheduled reporting:- Open the toolkit web interface and navigate to the Settings tab.
- In the Schedule Reports card, enter a cron expression in the Cron Expression field to specify the frequency and timing for the reports.
- Click Update Schedule.
By default:
- The schedule is set to once a day.
- A maximum number of 10 reports are saved at any one time.
Use scheduled reports during system disruptions
In case of a system disruption or outage:- Access the most recent “healthy state” report from the stored scheduled reports.
- Generate an immediate system health report (if possible).
- Compare the two reports to identify any deviations or unusual activities.
Check timeout configuration
By default, each individual check in a toolkit scan is allowed 60 seconds to complete before it times out with an error. You can increase this limit for environments where checks take longer due to cluster size or load. Set theCHECK_TIMEOUT_SECONDS environment variable on the toolkit deployment (for example via Helm podEnv on the domino-admin-toolkit container):
Per-check timeout overrides are also available in the check source code using the
@pytest.mark.check_timeout(seconds) marker, but these are set by the toolkit developers and cannot be changed without modifying the toolkit itself.Understand and resolve failures
The Admin Toolkit documentation provides comprehensive information about the checks, their meanings, and any details on resolving issues. Use the toolkit and its documentation to quickly identify and resolve issues, and ensure optimal performance of the Domino platform. You can access the documentation in two ways:- Publicly accessible online documentation: https://docs.toolkit.re.domino.tech/ (always updated to the latest version of the toolkit).
-
Documentation included within the Domino deployment:
https://<your-domino-url>/toolkit/docs/(specific to the deployed version of the toolkit).