The following sections describe the basic troubleshooting steps and useful tools that cover the overall Domino platform health.

Admin Toolkit

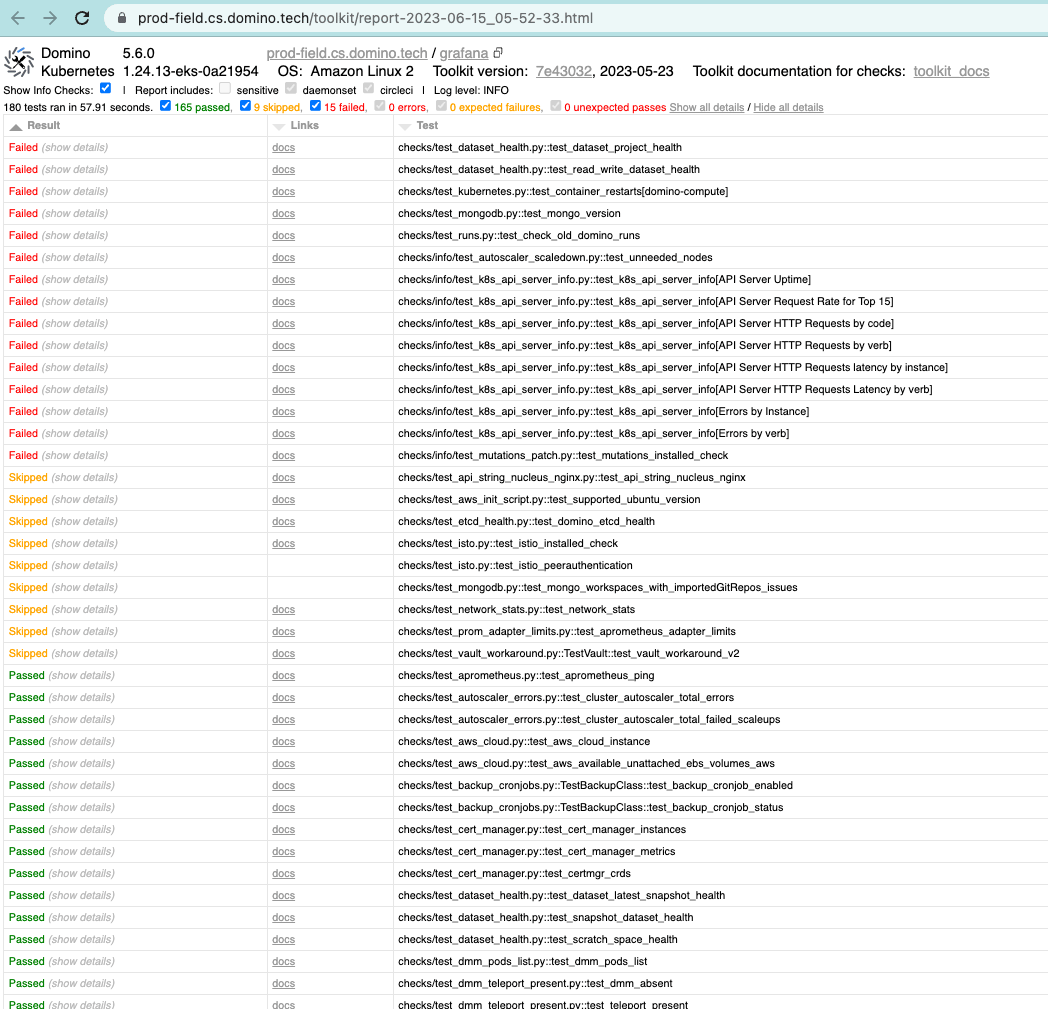
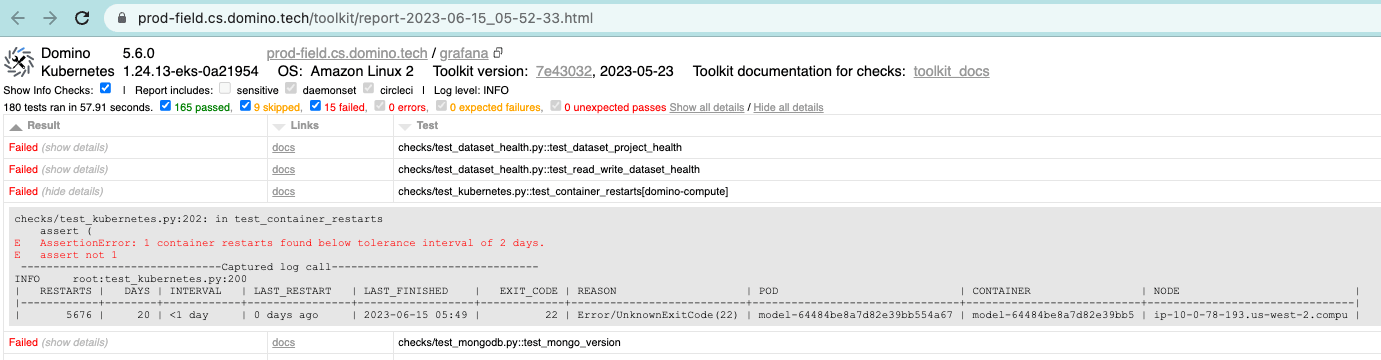
Deploy the Domino Admin toolkit if you have not already. Use the Admin toolkit to run a health check and observe the overall system status. Admin toolkit dashboard Expand each failed section to get more information. Admin toolkit entries
Grafana dashboards

Domino Grafana dashboards provide various metric visualizations around Domino services. For production deployments, a Grafana instance is deployed and externally accessible at <domino url>/grafana. The default username is grafana and the password is stored in the cluster.
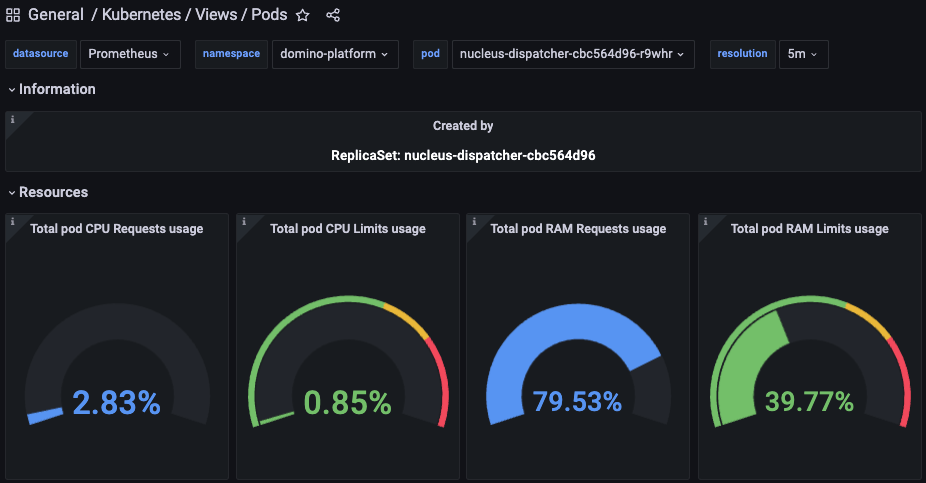
There are preconfigured dashboards that are readily available for review during troubleshooting. Below is an example of the Nucleus dispatcher’s health. Grafana Dashboard

Kubernetes pod health

Check if there are any pods that are not in Active or Completed status, as this is the starting place to look at potential issues.
Monitor the RESTARTS column. If there are many restarts of a certain pod, that pod is having issues. Describing the pods should give you more information as to why they are not in the running state or frequently restart.

Kubernetes events

Kubernetes events usually provide underlying issues behind the user experience. Look for related events in domino-platform and domino-compute namespaces sorted by time stamp.

Resource availability

Sometimes pods can exceed the CPU and memory limits imposed by the default Kubernetes configuration.
The following shows the CPU and memory usage of the current nodes.

Next steps

The following sections provide useful steps to troubleshoot:
Last modified on July 16, 2026