

- Monitor experiments with both automatic and manual logging.
- Compare and review experiment runs effectively.
- Collaborate securely with colleagues.
Experiment types
You can log two types of experiments in Domino: Traditional ML experiments track parameters, metrics, and artifacts from model training workflows. When you train a model, Domino logs the configuration settings, performance metrics, and output files so you can compare different approaches. You use traditional ML experiments when you train machine learning models with scikit-learn, TensorFlow, PyTorch, or similar frameworks. Agentic system experiments capture traces from LLM calls, agent interactions, and prompt chains. A trace shows the sequence of calls your system makes, including inputs, outputs, and downstream tool calls. You can attach evaluations to traces to measure quality, accuracy, or safety. You use agentic system experiments when you build applications with LLMs or AI agents.How experiments work in Domino
When you click Experiments in the Domino left navigation, you’ll see an empty dashboard unless at least one run has been logged. Domino doesn’t create experiments through the UI. Instead-
You create an MLFlow experiment by calling
mlflow.set_experiment()in code. - The experiment appears in the UI only after you log at least one run.
username) as part of your experiment name.
Step 1: Create and log an experiment run
Launch a workspace or job to run your experiment code and log results to the Experiment Manager. Jobs provide better reproducibility and version control.- From your project, click Workspaces in the left navigation.
-
Launch a workspace using any environment based on the Domino Standard Environment. These environments already have the
mlflowpackage installed. - Open a Python script or notebook to run your experiment code.
- Auto-logging
- Manual logging
This example shows you how to auto-log a scikit-learn experiment.
Step 2: Monitor and evaluate experiments
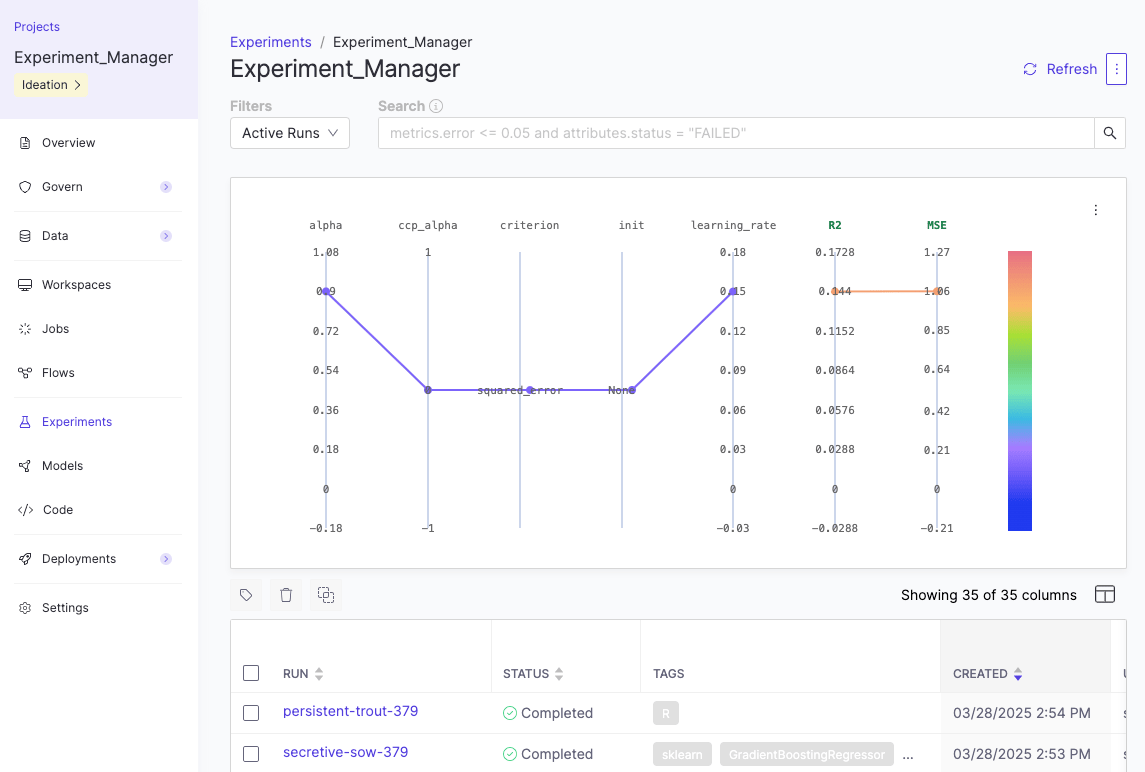
Once you have logged at least one run in an experiment, you can view and analyze it in Domino.- Click Experiments in Domino’s left navigation pane.
- Find and click the experiment to evaluate and show its associated runs.
- Click a run to analyze the results in detail.
Traditional ML experiments
When you log traditional ML experiments, Domino captures parameters, metrics, and artifacts from your model training. Here’s how to view and compare your results: View metrics and artifactsThe run details show parameters you configured, metrics that measure performance, and artifacts like model files or visualizations logged during training. You can:
- Review parameter values to understand your configuration
- Track metrics over time to measure model performance
-
Download artifacts like trained models, plots, or data files
Compare runs
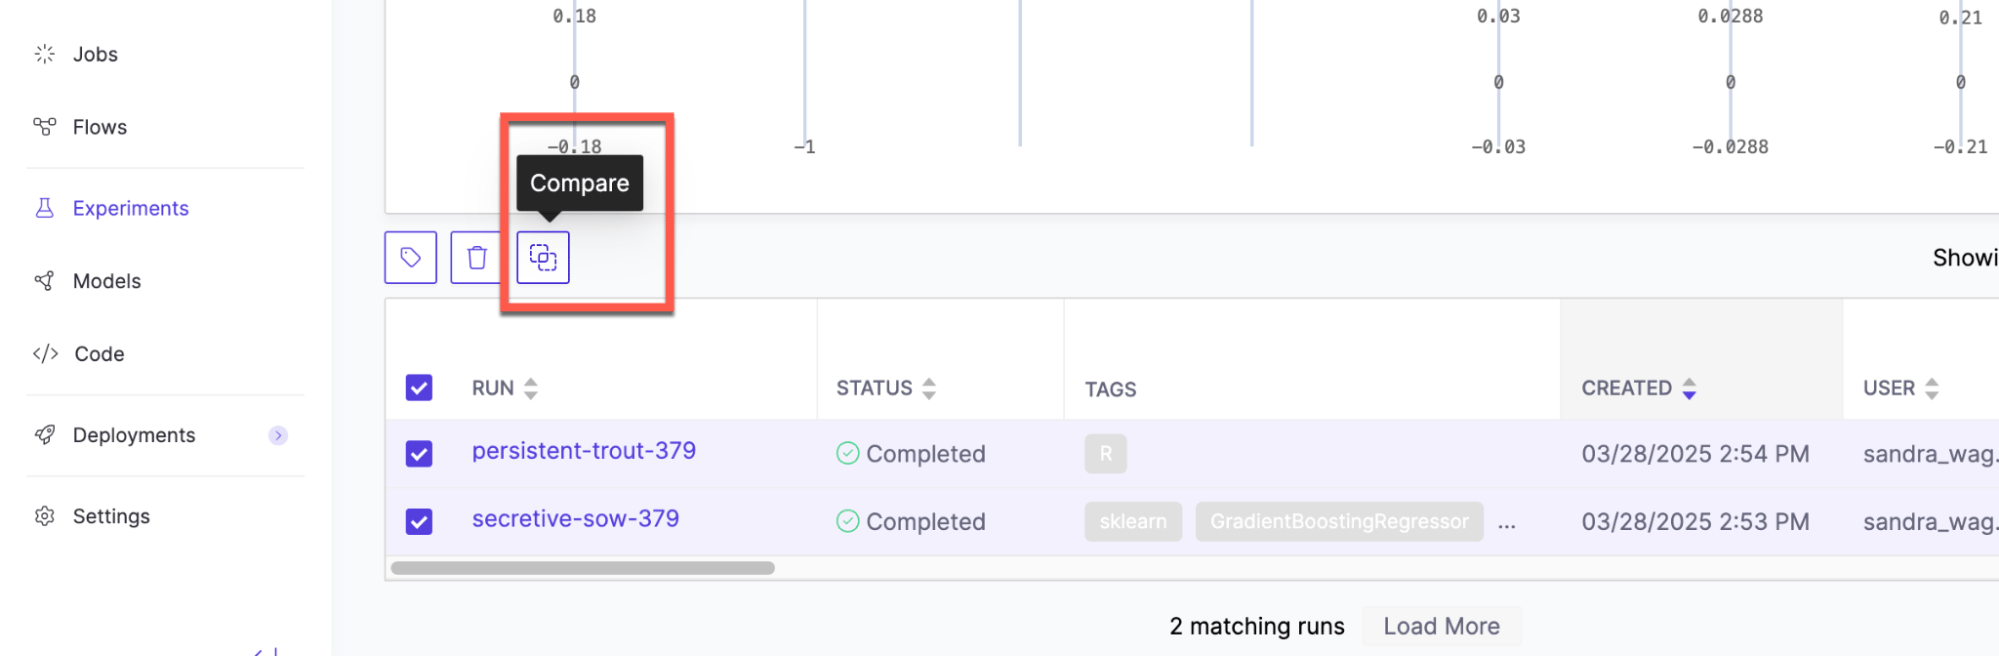
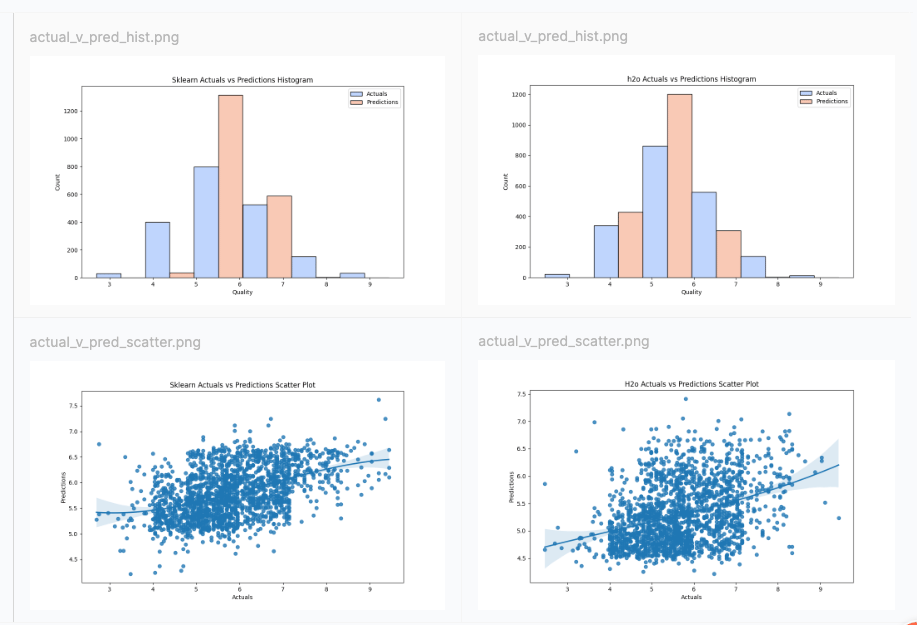
After reviewing individual runs, you can compare multiple runs to see how different configurations affect outcomes. Select up to four runs from the table view and click Compare.
Agentic system experiments
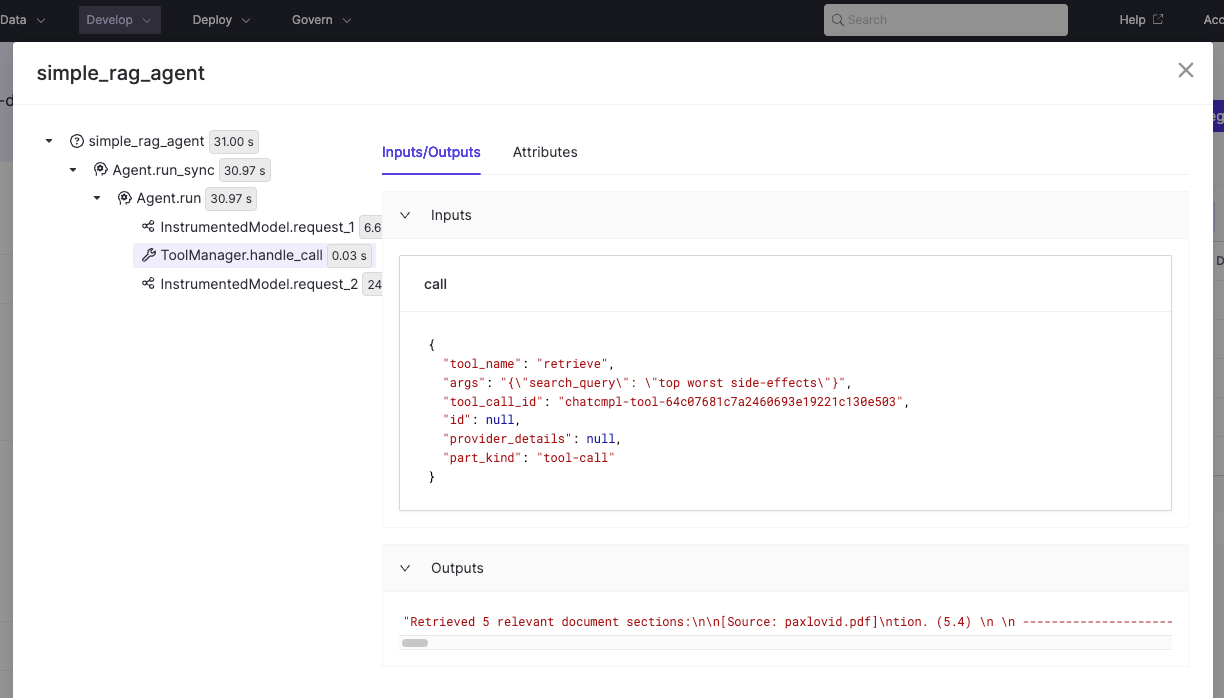
When you log agentic system experiments, Domino captures traces from LLM calls and agent interactions. Here’s how to view and compare your traces: View tracesWhen you open a run from an agentic system experiment, select the Traces tab to see the sequence of calls made during execution.
- See evaluations that were logged in code
- Add metrics (float values) or labels (string values) to traces by clicking Add Metric/Label
-
Click any metric or label cell to open the detailed trace view
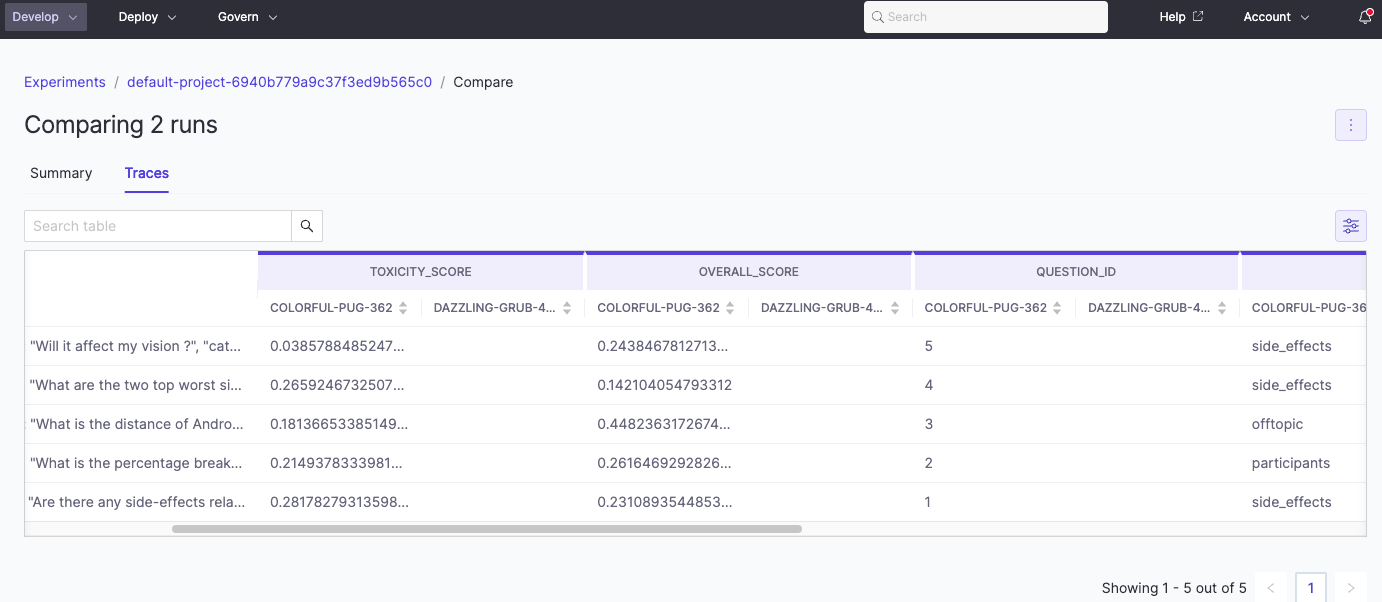
Compare traces
When comparing agentic system runs, open the Traces comparison view to see how configurations perform on the same inputs.
Step 3: Export experiment results
You can export your single experiment results to a CSV or compare experiments and download to a PDF. To export single experiment results:- From the Experiments view, open the experiment you want to export.
- Click the three dots in the upper right and choose Download CSV.
- From the Experiments view, select two to four runs and click Compare.
- Click the three dots in the upper right and choose Export as PDF.
Step 4: Share your projects and experiments
You can set permissions for project assets, including MLflow logs, on a project level. Use these methods on your projects to control access:-
Choose the visibility for your project. This helps you control who can see your project.
- Searchable: Discoverable by other Domino users.
- Private: Only viewable or discoverable by your project collaborators.
- Invite collaborators and set their permissions based on project roles. This gives you detailed control over what they can access.
Troubleshooting
- Experiment names must be unique across all projects within the same Domino instance.
- Child runs aren’t deleted when you delete a run that has children. Delete the child runs separately.
-
You can’t stop a run from the UI. To stop a run, execute
mlflow.end_run()from your workspace or job. - When you trigger an experiment from a workspace, the manager shows the file name. But if you are running that and editing it, it doesn’t rename the experiment automatically. After completing an experiment in a workspace, trigger a job to manage version control.
-
Best practice is to give your runs a name - otherwise it automatically creates one like
gifted-slug-123.
Advanced functionality
You can upload large artifact files directly to blob storage without going through the MLflow proxy server. Enable this feature in your notebook code by setting the environment variableMLFLOW_ENABLE_PROXY_MULTIPART_UPLOAD to true.
log_artifact calls and registering large language models. It is currently supported only in AWS and GCP environments. There are two additional settings available for configuration:
-
MLFLOW_MULTIPART_UPLOAD_MINIMUM_FILE_SIZE- the minimum file size required to initiate multipart uploads. -
MLFLOW_MULTIPART_UPLOAD_CHUNK_SIZE- the size of each chunk of the multipart upload. Note that a file may be divided into a maximum of 1000 chunks.
Next steps
- Build a transaction review App with a Workspace, Dataset, model endpoint, and App.
- Schedule recurring training jobs.
- Scale-out training for larger datasets.
- Monitor model endpoints to track resource usage and optimize deployed models for production.