

-
In the navigation pane, click Govern > Cost center.
The first chart is a bar chart of deployment compute spend in USD, along with memory costs of executions, for each day in the current month.
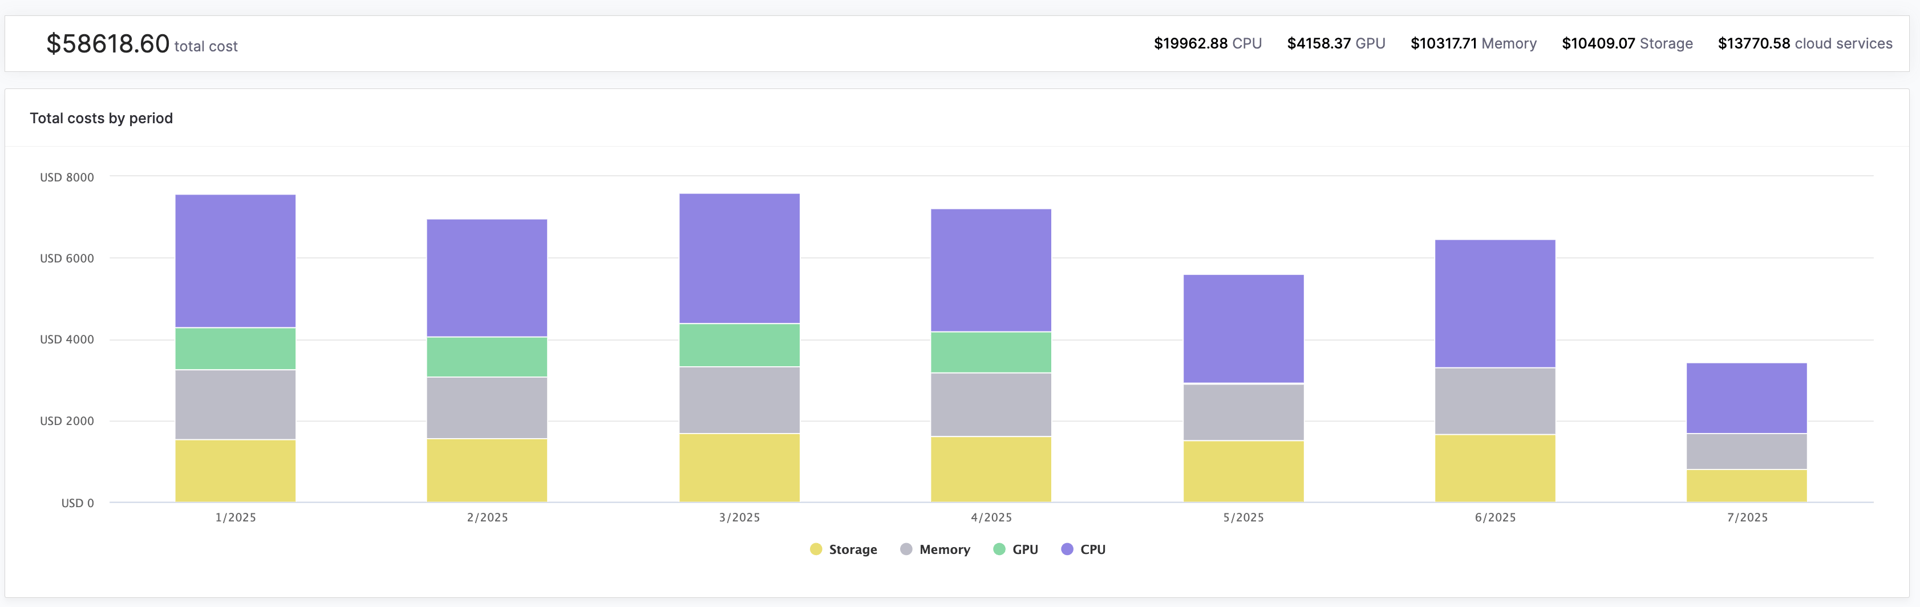
- Use the date menu to change the date range.
- Use the Compute Spend ($) menu to change the chart to show compute usage by hours of runtime.
- Projects can be charted by compute spend (USD) or compute hours.
- Users can be charted by compute spend (USD) or compute hours.
- Hardware tiers can be charted by average run queue time in minutes.